Attached files
| file | filename |
|---|---|
| 8-K - FORM 8-K - SYNOVUS FINANCIAL CORP | g20871e8vk.htm |
| EX-99.1 - EX-99.1 - SYNOVUS FINANCIAL CORP | g20871exv99w1.htm |
| EX-99.2 - EX-99.2 - SYNOVUS FINANCIAL CORP | g20871exv99w2.htm |
Exhibit 99.3
| Third Quarter 2009 Results October 22, 2009 1 |
| Forward-Looking Statements This slide presentation contains statements that constitute “forward-looking statements” within the meaning of the Securities Act of 1933 and the Securities Exchange Act of 1934 as amended by the Private Securities Litigation Reform Act of 1995. These forward-looking statements include, among others, our statements regarding (1) statements that are problem asset strategy remains on track; (2) our expectations regarding trends in core deposits, core expenses and net interest margin; (3) our expectations regarding continued improvement in the quality of our deposit mix; (4) our belief in our demonstrated core earnings potential in a more favorable credit environment; (5) our expectations regarding execution of our capital plan; (6) our expectations regarding disposition of problem assets and losses to be incurred on liquidation of such assets; (7) our expectations regarding the net interest margin; (8) our expectations regarding past due loans; (9) assumptions regarding execution of our capital plan; and (10) management's estimate of probable losses to be incurred on loan dispositions over the next two quarters; (11) the assumptions underlying our expectations. Prospective investors are cautioned that any such forward-looking statements are not guarantees of future performance and involve risks and uncertainties, and that actual results may differ materially from those contemplated by such forward-looking statements. A number of important factors could cause actual results to differ materially from those contemplated by the forward-looking statements in this slide presentation and our #lings with the Securities and Exchange Commission (“SEC”), and you should review this slide presentation in conjunction with our Annual Report on Form 10-K, our Quarterly Reports on Form 10-Q, our Current Reports on Form 8-K, and our other #lings with the SEC. Many of these factors are beyond Synovus’ ability to control or predict. 2 |
| Factors that could cause actual results to differ materially from those contemplated in this slide presentation and our #lings with the SEC include: (1) further deterioration in credit quality, particularly in residential construction and development loans, may continue to result in increased non-performing assets and credit losses, which will adversely impact our earnings and capital; (2) declining values of residential real estate may result in further write-downs of assets, which may increase our credit losses and negatively affect our #nancial results; (3) continuing weakness in the residential real estate environment may negatively impact our ability to liquidate non-performing assets; (4) the impact on our borrowing costs, capital cost and our liquidity due to adverse changes in our current credit ratings; (5) our ability to manage $uctuations in the value of our assets and liabilities to maintain sufficient capital and liquidity to support our operations; (6) restrictions or limitations on access to funds from subsidiaries, thereby restricting our ability to make payments on our obligations or dividend payments; (7) continuing deterioration in general economic conditions and conditions in the #nancial markets; (8) inadequacy of our allowance for loan losses, or the risk that the allowance may prove to be inadequate or may be negatively affected by credit risk exposures; (9) changes in the interest rate environment which may increase funding costs and reduce earning assets yields, thus reducing margins; (10) risks associated with the concentration of our non-performing assets in certain geographic regions and with affiliated borrowing groups; (11) the risk of additional future losses if the proceeds we receive upon the liquidation of non-performing assets are less than the fair value of such assets; (12) risks associated with the execution of our capital plan; (13) the impact of the Emergency Economic Stabilization Act of 2008, the American Recovery and Reinvestment Act, The Financial Stability Plan and other recent and proposed changes in governmental policy, laws and regulations, including proposed and recently enacted changes in the regulation of banks and #nancial institutions, or the interpretation or application thereof, including restrictions, increased capital requirements, limitations and/or penalties arising from banking, securities and insurance laws regulations and examinations; (14) the impact on Synovus’ #nancial results, reputation and business if Synovus is unable to comply with all applicable federal and state regulations and applicable memoranda of understanding, other supervisory actions and any necessary capital initiatives; (15) risks associated with litigation; (16) the volatility of our stock price; and (17) the other factors set forth in Synovus’ #lings with the SEC, including its Annual Report on Form 10-K, quarterly reports on Form 10-Q and current reports on Form 8-K. We believe these forwardlooking statements are reasonable; however, undue reliance should not be placed on any forward-looking statements, which are based on current expectations. We do not assume any obligation to update any forward-looking statements as a result of new information, future developments or otherwise. 3 |
| Use of Non-GAAP Financial Measures This slide presentation contains certain non-GAAP #nancial measures determined by methods other than in accordance with generally accepted accounting principles. Such non-GAAP #nancial measures include the following: pre-tax, precredit costs income; core expenses; fundamental G&A expense; core deposits; net interest margin excluding negative impact of non-performing assets; fundamental non-interest expense; and the ratio of pre-tax, pre-credit costs income to risk weighted assets, and the tangible common equity to tangible assets ratio. The most comparable GAAP measures to these measures are pre-tax income (loss); total G&A expenses; total non-interest expense; total deposits; net interest margin; total non-interest expence and the ratio of total equity to total assets, respectively. Management uses these non-GAAP #nancial measures to assess the performance of Synovus’ core business and the strength of its capital position. Synovus believes that these non-GAAP #nancial measures provide meaningful additional information about Synovus to assist investors in evaluating Synovus’ operating results, #nancial strength and capitalization. The non-GAAP measures should be considered as additional views of the way our #nancial measures are affected by signi#cant charges for credit costs and goodwill impairment. The tangible common equity ratio to tangible assets ratio and tangible common equity to risk-weighted assets ratio are used by management to assess the strength of our capital position. Core deposits are a measure used by management and investment analysts to evaluate organic growth of deposits and the quality of deposits as a funding source. Pre-tax, pre-credit costs income is a measure used by management to evaluate core operating results exclusive of credit costs as well as certain non-core expenses such as goodwill impairment charges, restructuring charges, and Visa litigation expense (recovery). Fundamental non-interest expense is a measure utilized by management to measure the success of expense management initiatives focused on reducing recurring controllable operating costs. These non-GAAP #nancial measures should not be considered as a substitute for operating results determined in accordance with GAAP and may not be comparable to other similarly titled measures of other companies. The computations of the non-GAAP #nancial measures used in this slide presentation are set forth in the Appendix to this slide presentation. 4 |
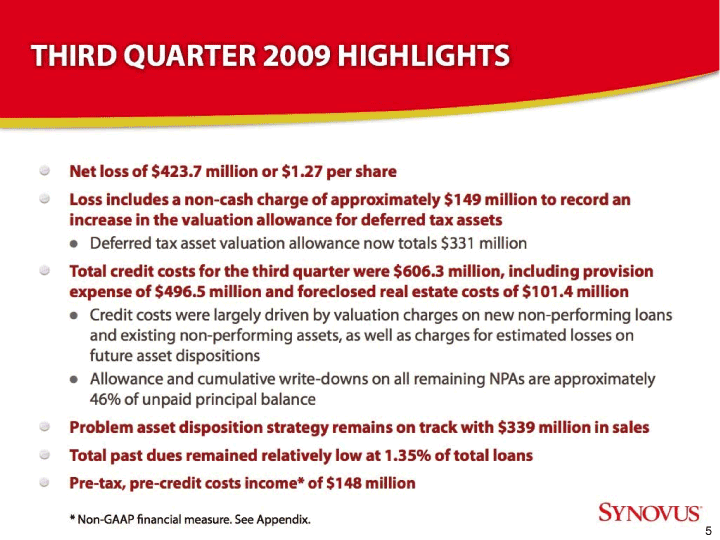
| THIRD QUARTER 2009 HIGHLIGHTS Net loss of $423.7 million or $1.27 per share Loss includes a non-cash charge of approximately $149 million to record an increase in the valuation allowance for deferred tax assets • Deferred tax asset valuation allowance now totals $331 million Total credit costs for the third quarter were $606.3 million, including provision expense of $496.5 million and foreclosed real estate costs of $101.4 million • Credit costs were largely driven by valuation charges on new non-performing loans and existing non-performing assets, as well as charges for estimated losses on future asset dispositions • Allowance and cumulative write-downs on all remaining NPAs are approximately 46% of unpaid principal balance Problem asset disposition strategy remains on track with $339 million in sales Total past dues remained relatively low at 1.35% of total loans Pre-tax, pre-credit costs income* of $148 million * Non-GAAP #nancial measure. See Appendix. 5 |
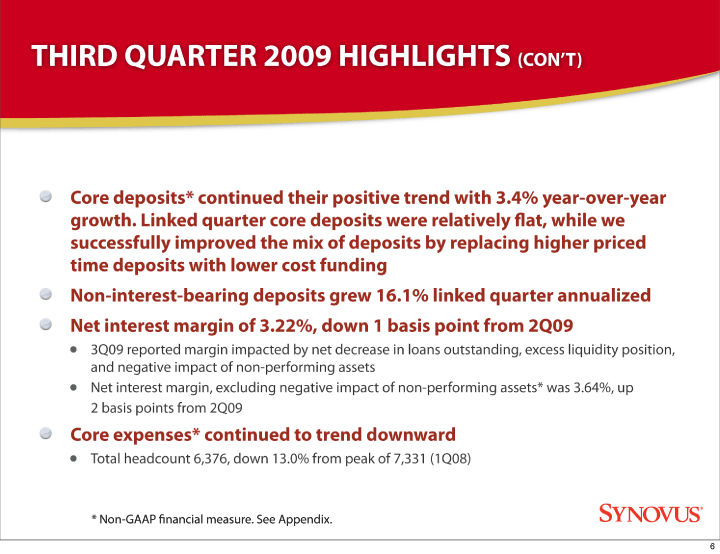
| THIRD QUARTER 2009 HIGHLIGHTS (CON’T) Core deposits* continued their positive trend with 3.4% year-over-year growth. Linked quarter core deposits were relatively !at, while we successfully improved the mix of deposits by replacing higher priced time deposits with lower cost funding Non-interest-bearing deposits grew 16.1% linked quarter annualized Net interest margin of 3.22%, down 1 basis point from 2Q09 • 3Q09 reported margin impacted by net decrease in loans outstanding, excess liquidity position, and negative impact of non-performing assets • Net interest margin, excluding negative impact of non-performing assets* was 3.64%, up 2 basis points from 2Q09 Core expenses* continued to trend downward • Total headcount 6,376, down 13.0% from peak of 7,331 (1Q08) * Non-GAAP #nancial measure. See Appendix. 6 |
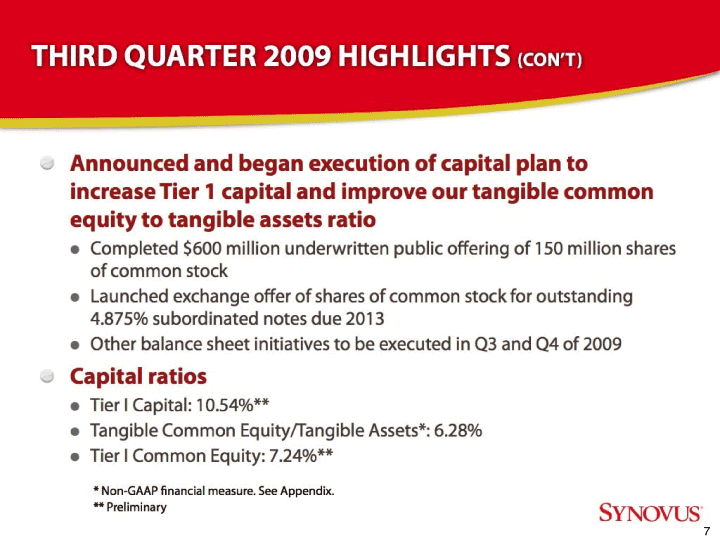
| THIRD QUARTER 2009 HIGHLIGHTS (CON’T) Announced and began execution of capital plan to increase Tier 1 capital and improve our tangible common equity to tangible assets ratio • Completed $600 million underwritten public offering of 150 million shares of common stock • Launched exchange offer of shares of common stock for outstanding 4.875% subordinated notes due 2013 • Other balance sheet initiatives to be executed in Q3 and Q4 of 2009 Capital ratios • Tier I Capital: 10.54% ** • Tangible Common Equity/Tangible Assets*: 6.28% • Tier I Common Equity: 7.24% ** Non-GAAP #nancial measure. See Appendix. 7 ** Preliminary |

| FINANCIAL RESULTS 8 |
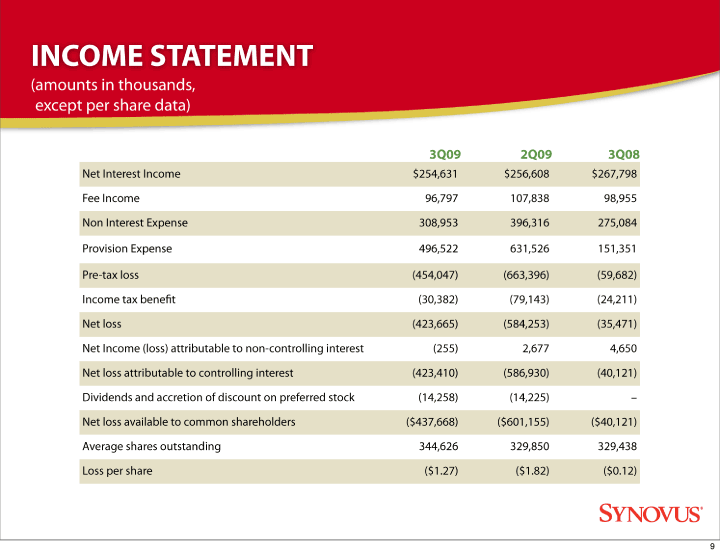
| INCOME STATEMENT 3Q09 2Q09 3Q08 Net Interest Income $254,631 $256,608 $267,798 Fee Income 96,797 107,838 98,955 Non Interest Expense 308,953 396,316 275,084 Provision Expense 496,522 631,526 151,351 Pre-tax loss (454,047) (663,396) (59,682) Income tax bene#t (30,382) (79,143) (24,211) Net loss (423,665) (584,253) (35,471) Net Income (loss) attributable to non-controlling interest (255) 2,677 4,650 Net loss attributable to controlling interest (423,410) (586,930) (40,121) Dividends and accretion of discount on preferred stock (14,258) (14,225) — Net loss available to common shareholders ($437,668) ($601,155) ($40,121) Average shares outstanding 344,626 329,850 329,438 Loss per share ($1.27) ($1.82) ($0.12) (amounts in thousands, except per share data) 9 |
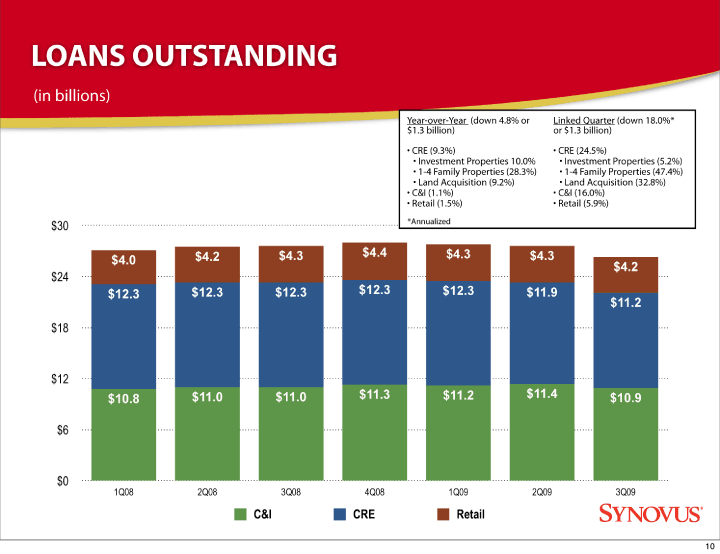
| LOANS OUTSTANDING $0 $6 $12 $18 $24 $30 1Q08 2Q08 3Q08 4Q08 1Q09 2Q09 3Q09 $4.2 $4.0 $4.2 $4.3 $4.4 $4.3 $4.3 $11.2 $12.3 $12.3 $12.3 $12.3 $12.3 $11.9 $10.8 $11.0 $11.0 $11.3 $11.2 $11.4 $10.9 C&I CRE Retail Year-over-Year (down 4.8% or $1.3 billion) Linked Quarter (down 18.0%* or $1.3 billion) · CRE (9.3%) • Investment Properties 10.0% • 1-4 Family Properties (28.3%) • Land Acquisition (9.2%) • C&I (1.1%) • Retail (1.5%) • CRE (24.5%) • Investment Properties (5.2%) • 1-4 Family Properties (47.4%) • Land Acquisition (32.8%) • C&I (16.0%) • Retail (5.9%) *Annualized (in billions) 10 |
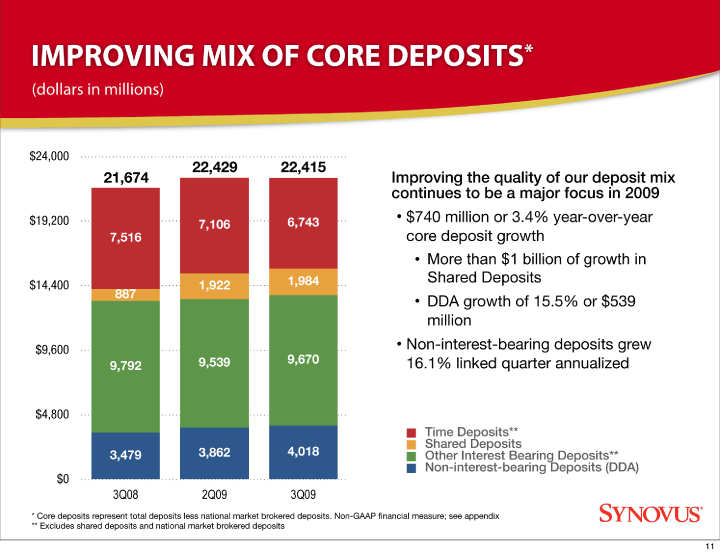
| 11 IMPROVING MIX OF CORE DEPOSITS* $0 $4,800 $9,600 $14,400 $19,200 $24,000 3Q08 2Q09 3Q09 7,106 6,743 7,516 1,922 1,984 887 9,792 9,539 9,670 3,479 3,862 4,018 Non-interest-bearing Deposits (DDA) Other Interest Bearing Deposits** Shared Deposits Time Deposits** 21,674 22,415 Improving the quality of our deposit mix continues to be a major focus in 2009 • $740 million or 3.4% year-over-year core deposit growth • More than $1 billion of growth in Shared Deposits • DDA growth of 15.5% or $539 million • Non-interest-bearing deposits grew 16.1% linked quarter annualized * Core deposits represent total deposits less national market brokered deposits. Non-GAAP financial measure; see appendix ** Excludes shared deposits and national market brokered deposits (dollars in millions) 22,429 11 |
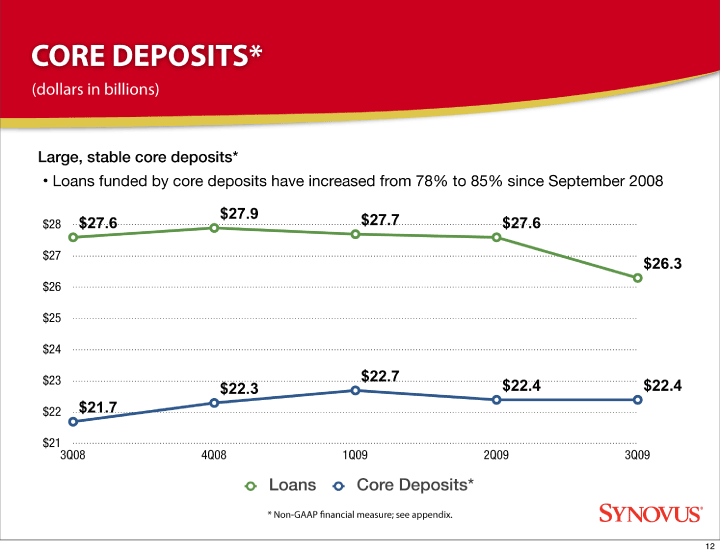
| $21 $22 $23 $24 $25 $26 $27 $28 3Q08 4Q08 1Q09 2Q09 3Q09 $21.7 $22.3 $22.7 $22.4 $22.4 $27.6 $27.9 $27.7 $27.6 $26.3 CORE DEPOSITS* Large, stable core deposits* • Loans funded by core deposits have increased from 78% to 85% since September 2008 (dollars in billions) Loans Core Deposits* * Non-GAAP #nancial measure; see appendix. 12 |
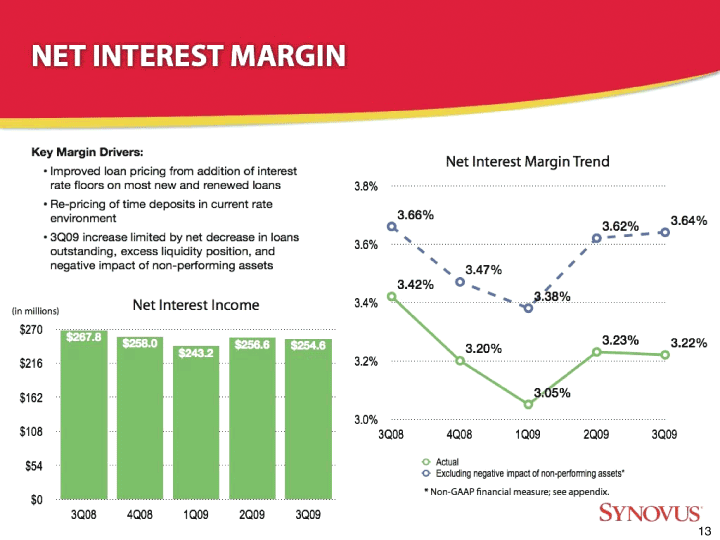
| NET INTEREST MARGIN $0 $54 $108 $162 $216 $270 3Q08 4Q08 1Q09 2Q09 3Q09 $256.6 $254.6 $243.2 $267.8 $258.0 Net Interest Income 3.0% 3.2% 3.4% 3.6% 3.8% 3Q08 4Q08 1Q09 2Q09 3Q09 3.66% 3.47% 3.38% 3.62% 3.64% 3.42% 3.20% 3.05% 3.23% 3.22% Net Interest Margin Trend Actual Excluding negative impact of non-performing assets* * Non-GAAP #nancial measure; see appendix. (in millions) Key Margin Drivers: • Improved loan pricing from addition of interest rate floors on most new and renewed loans • Re-pricing of time deposits in current rate environment • 3Q09 increase limited by net decrease in loans outstanding, excess liquidity position, and negative impact of non-performing assets. 13 |
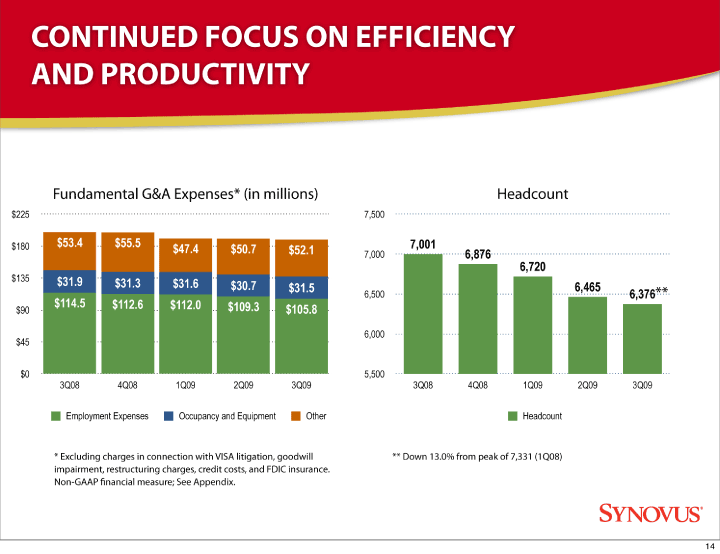
| CONTINUED FOCUS ON EFFICIENCY AND PRODUCTIVITY $0 $45 $90 $135 $180 $225 3Q08 4Q08 1Q09 2Q09 3Q09 $53.4 $55.5 $47.4 $50.7 $52.1 $31.9 $31.3 $31.6 $30.7 $31.5 $114.5 $112.6 $112.0 $109.3 $105.8 Fundamental G&A Expenses* (in millions) Employment Expenses Occupancy and Equipment Other * Excluding charges in connection with VISA litigation, goodwill impairment, restructuring charges, credit costs, and FDIC insurance. Non-GAAP #nancial measure; See Appendix. 5,500 6,000 6,500 7,000 7,500 3Q08 4Q08 1Q09 2Q09 3Q09 7,001 6,876 6,720 6,465 6,376 Headcount Headcount ** ** Down 13.0% from peak of 7,331 (1Q08) 14 |
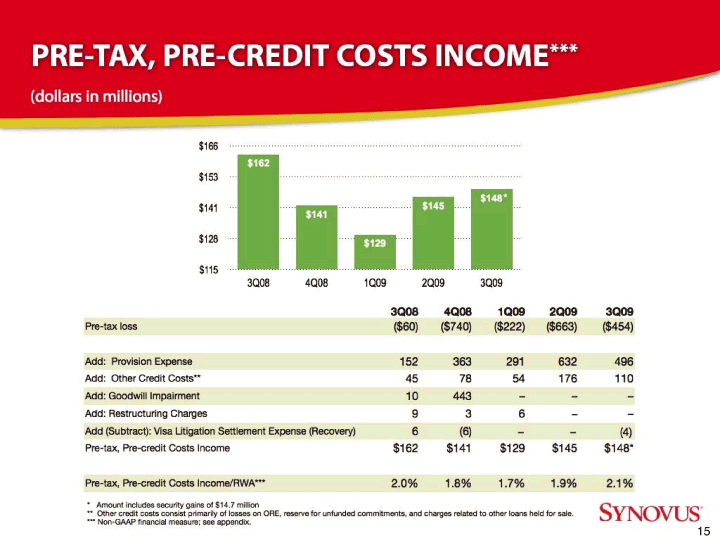
| 15 PRE-TAX, PRE-CREDIT COSTS INCOME*** * Amount includes security gains of $14.7 million ** Other credit costs consist primarily of losses on ORE, reserve for unfunded commitments, and charges related to other loans held for sale. *** Non-GAAP financial measure; see appendix. 3Q08 4Q08 1Q09 2Q09 3Q09 Pre-tax loss ($60) ($740) ($222) ($663) ($454) Add: Provision Expense 152 363 291 632 496 Add: Other Credit Costs** 45 78 54 176 110 Add: Goodwill Impairment 10 443 — - — Add: Restructuring Charges 9 3 6 — - Add (Subtract): Visa Litigation Settlement Expense (Recovery) 6 (6) — - (4) Pre-tax, Pre-credit Costs Income $162 $141 $129 $145 $148* Pre-tax, Pre-credit Costs Income/RWA*** 2.0% 1.8% 1.7% 1.9% 2.1% $115 $132 $149 $166 $183 3Q08 4Q08 1Q09 2Q09 3Q09 $145 $148 $129 $141 $162 (dollars in millions) * 15 |

| Credit Update 16 |
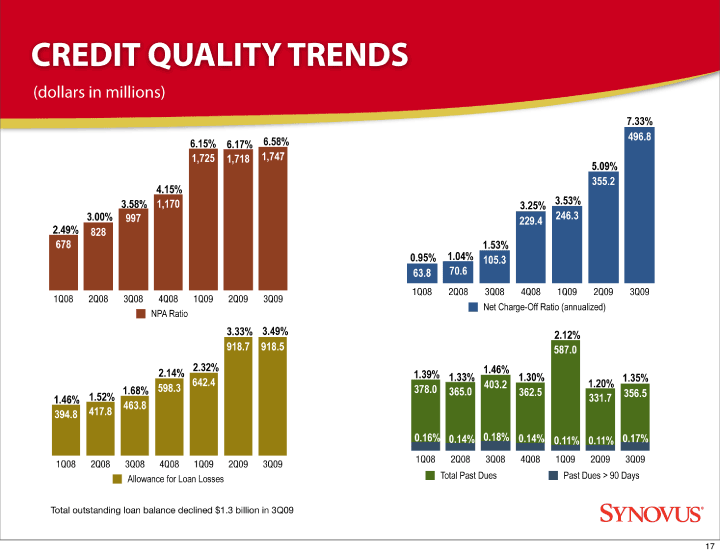
| 331.7 356.5 587.0 378.0 365.0 403.2 362.5 1Q08 2Q08 3Q08 4Q08 1Q09 2Q09 3Q09 Total Past Dues Past Dues > 90 Days CREDIT QUALITY TRENDS 1Q08 2Q08 3Q08 4Q08 1Q09 2Q09 3Q09 918.7 918.5 598.3 642.4 394.8 417.8 463.8 1Q08 2Q08 3Q08 4Q08 1Q09 2Q09 3Q09 1,725 1,718 1,747 1,170 997 828 678 NPA Ratio Allowance for Loan Losses Net Charge-Off Ratio (annualized) 2.49% 6.15% 4.15% 3.58% 3.00% 6.17% 6.58% 3.33% 1.68% 2.14% 2.32% 1.46% 1.52% (dollars in millions) Total outstanding loan balance declined $1.3 billion in 3Q09 7.33% 5.09% 3.25% 3.53% 1.53% 0.95% 1.04% 3.49% 1.39% 1.33% 1.46% 1.30% 2.12% 1.20% 1.35% 0.16% 0.14% 0.18% 0.14% 0.11% 0.11% 0.17% 1Q08 2Q08 3Q08 4Q08 1Q09 2Q09 3Q09 496.8 355.2 229.4 246.3 105.3 63.8 70.6 17 |
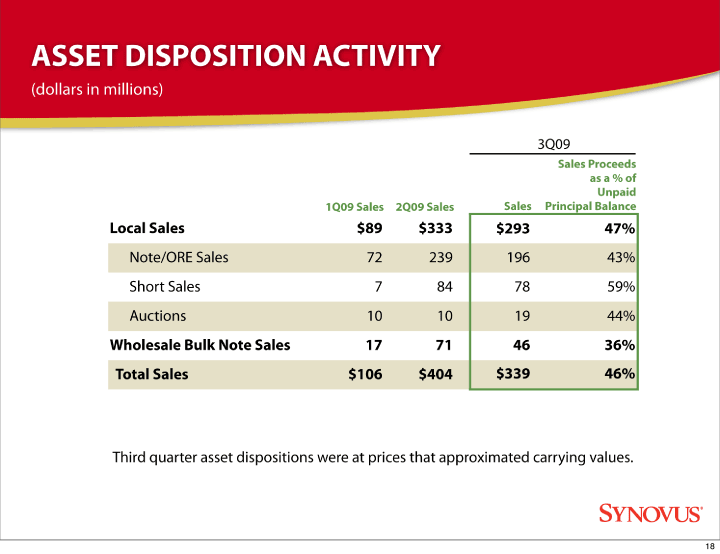
| ASSET DISPOSITION ACTIVITY 3Q09 1Q09 Sales 2Q09 Sales Sales Sales Proceeds as a % of Unpaid Principal Balance Local Sales $89 $333 $293 47% Note/ORE Sales 72 239 196 43% Short Sales 7 84 78 59% Auctions 10 10 19 44% Wholesale Bulk Note Sales 17 71 46 36% Total Sales $106 $404 $339 46% (dollars in millions) Third quarter asset dispositions were at prices that approximated carrying values. 18 |
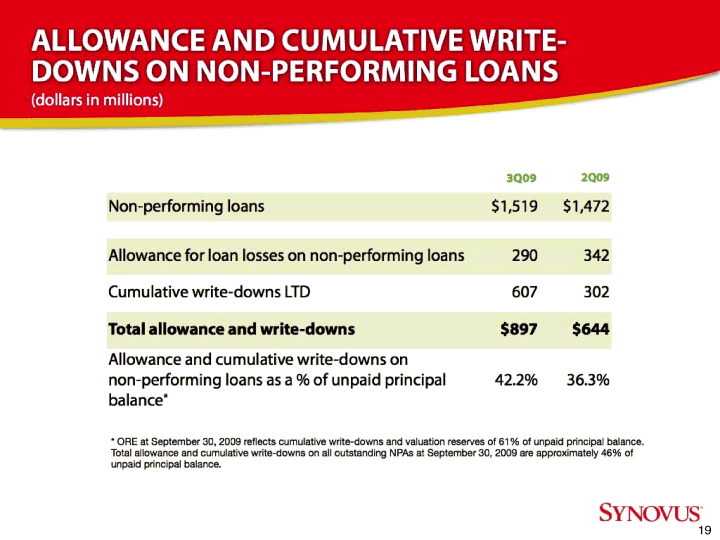
| ALLOWANCE AND CUMULATIVE WRITEDOWNS ON NON-PERFORMING LOANS 3Q09 2Q09 Non-performing loans $1,519 $1,472 Allowance for loan losses on non-performing loans 290 342 Cumulative write-downs LTD 607 302 Total allowance and write-downs $897 $644 Allowance and cumulative write-downs on non-performing loans as a % of unpaid principal balance* 42.2% 36.3% (dollars in millions) * ORE at September 30, 2009 reflects cumulative write-downs and valuation reserves of 61% of unpaid principal balance. Total allowance and cumulative write-downs on all outstanding NPAs at September 30, 2009 are approximately 46% of unpaid principal balance. 19 |
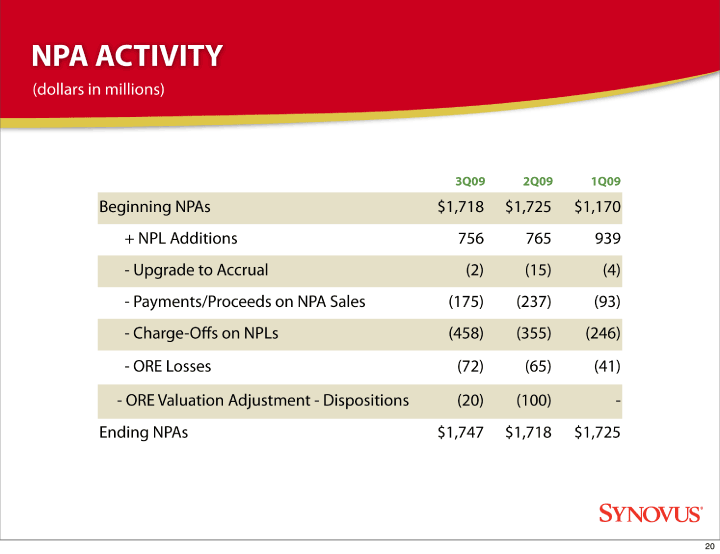
| NPA ACTIVITY 3Q09 2Q09 1Q09 Beginning NPAs $1,718 $1,725 $1,170 + NPL Additions 756 765 939 - Upgrade to Accrual (2) (15) (4) — Payments/Proceeds on NPA Sales (175) (237) (93) — Charge-Offs on NPLs (458) (355) (246) — ORE Losses (72) (65) (41) — ORE Valuation Adjustment — Dispositions (20) (100) — Ending NPAs $1,747 $1,718 $1,725 (dollars in millions) 20 |
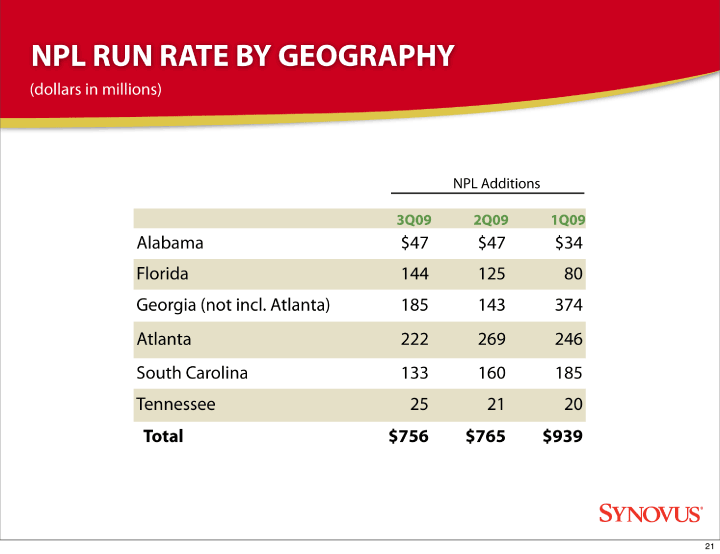
| NPL RUN RATE BY GEOGRAPHY NPL Additions 3Q09 2Q09 1Q09 Alabama $47 $47 $34 Florida 144 125 80 Georgia (not incl. Atlanta) 185 143 374 Atlanta 222 269 246 South Carolina 133 160 185 Tennessee 25 21 20 Total $756 $765 $939 (dollars in millions) 21 |
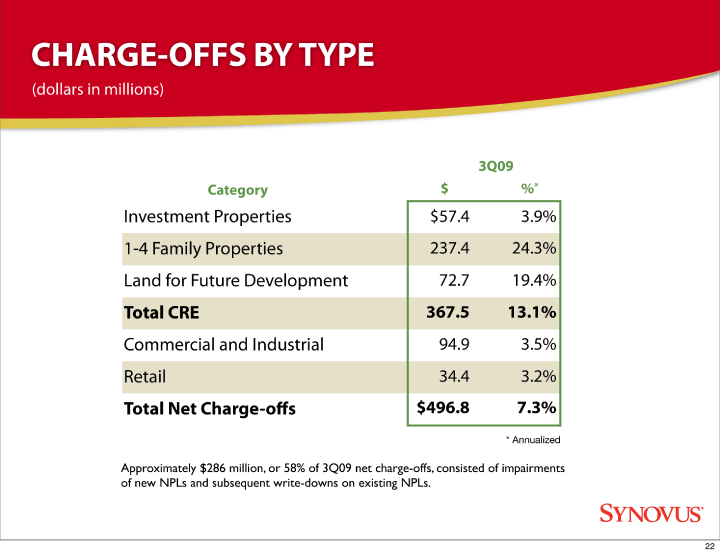
| CHARGE-OFFS BY TYPE 3Q09 Category $ %* Investment Properties $57.4 3.9% 1-4 Family Properties 237.4 24.3% Land for Future Development 72.7 19.4% Total CRE 367.5 13.1% Commercial and Industrial 94.9 3.5% Retail 34.4 3.2% Total Net Charge-offs $496.8 7.3% (dollars in millions) * Annualized Approximately $286 million, or 58% of 3Q09 net charge-offs, consisted of impairments of new NPLs and subsequent write-downs on existing NPLs. 22 |
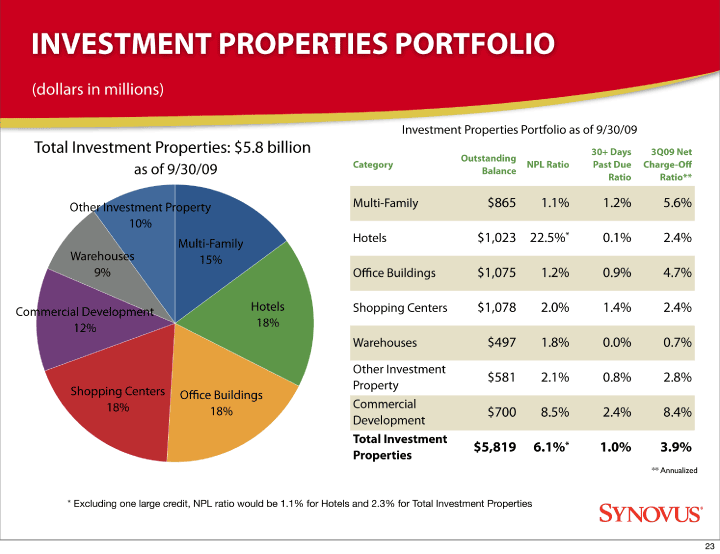
| INVESTMENT PROPERTIES PORTFOLIO Other Investment Property 10% Warehouses 9% Commercial Development 12% Shopping Centers 18% Office Buildings 18% Hotels 18% Multi-Family 15% Total Investment Properties: $5.8 billion as of 9/30/09 Category Outstanding Balance NPL Ratio 30+ Days Past Due Ratio 3Q09 Net Charge-Off Ratio** Multi-Family $865 1.1% 1.2% 5.6% Hotels $1,023 22.5%* 0.1% 2.4% Office Buildings $1,075 1.2% 0.9% 4.7% Shopping Centers $1,078 2.0% 1.4% 2.4% Warehouses $497 1.8% 0.0% 0.7% Other Investment Property $581 2.1% 0.8% 2.8% Commercial Development $700 8.5% 2.4% 8.4% Total Investment Properties $5,819 6.1%* 1.0% 3.9% Investment Properties Portfolio as of 9/30/09 * Excluding one large credit, NPL ratio would be 1.1% for Hotels and 2.3% for Total Investment Properties ** Annualized (dollars in millions) 23 |
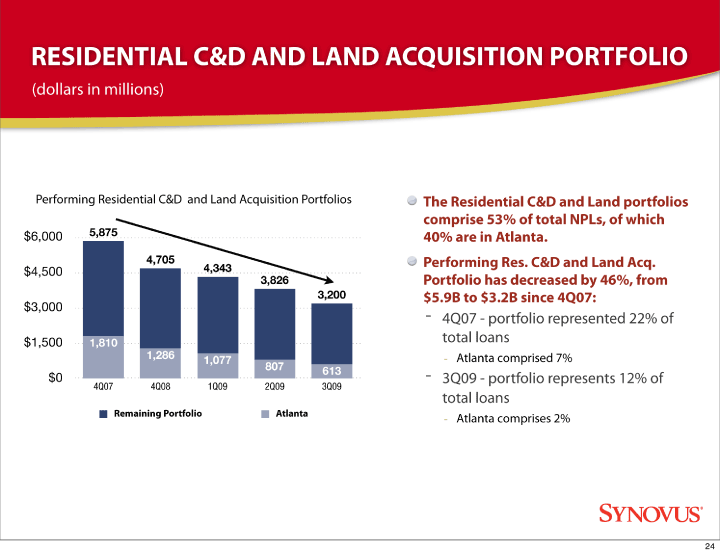
| 4Q07 4Q08 1Q09 2Q09 3Q09 3,200 3,826 4,343 4,705 5,875 $0 $1,500 $3,000 $4,500 $6,000 1,286 1,077 807 613 1,810 RESIDENTIAL C&D AND LAND ACQUISITION PORTFOLIO Remaining Portfolio Atlanta Performing Residential C&D and Land Acquisition Portfolios (dollars in millions) The Residential C&D and Land portfolios comprise 53% of total NPLs, of which 40% are in Atlanta. Performing Res. C&D and Land Acq. Portfolio has decreased by 46%, from $5.9B to $3.2B since 4Q07: - 4Q07 — portfolio represented 22% of total loans — Atlanta comprised 7% — 3Q09 — portfolio represents 12% of total loans - Atlanta comprises 2% 24 |
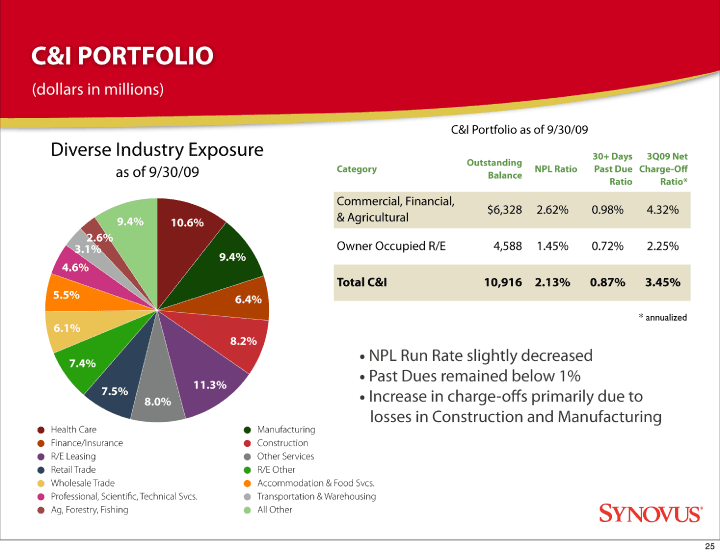
| C&I PORTFOLIO 9.4% 2.6% 3.1% 4.6% 5.5% 6.1% 7.4% 7.5% 8.0% 11.3% 8.2% 6.4% 9.4% 10.6% Diverse Industry Exposure Health Care Manufacturing Finance/Insurance Construction R/E Leasing Other Services Retail Trade R/E Other Wholesale Trade Accommodation & Food Svcs. Professional, Scientific, Technical Svcs. Transportation & Warehousing Ag, Forestry, Fishing All Other as of 9/30/09 Category Outstanding Balance NPL Ratio 30+ Days Past Due Ratio 3Q09 Net Charge-Off Ratio* Commercial, Financial, & Agricultural $6,328 2.62% 0.98% 4.32% Owner Occupied R/E 4,588 1.45% 0.72% 2.25% Total C&I 10,916 2.13% 0.87% 3.45% • NPL Run Rate slightly decreased • Past Dues remained below 1% • Increase in charge-offs primarily due to losses in Construction and Manufacturing * annualized (dollars in millions) C&I Portfolio as of 9/30/09 25 |
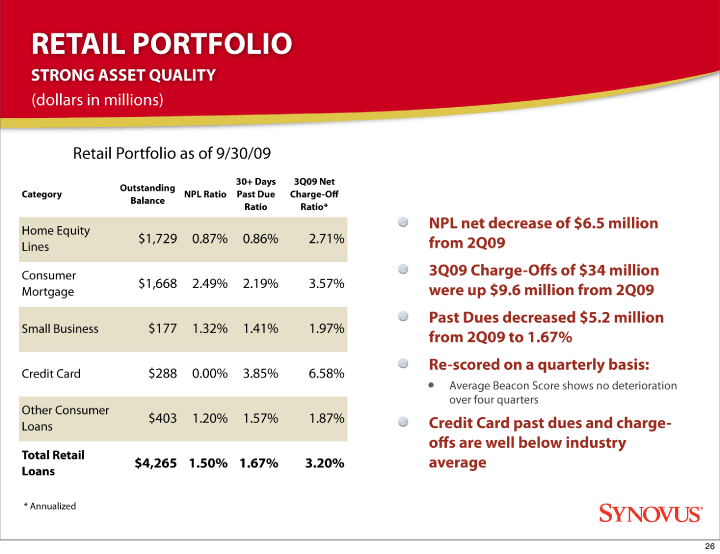
| RETAIL PORTFOLIO STRONG ASSET QUALITY Category Outstanding Balance NPL Ratio 30+ Days Past Due Ratio 3Q09 Net Charge-Off Ratio* Home Equity Lines $1,729 0.87% 0.86% 2.71% Consumer Mortgage $1,668 2.49% 2.19% 3.57% Small Business $177 1.32% 1.41% 1.97% Credit Card $288 0.00% 3.85% 6.58% Other Consumer Loans $403 1.20% 1.57% 1.87% Total Retail Loans $4,265 1.50% 1.67% 3.20% Retail Portfolio as of 9/30/09 (dollars in millions) NPL net decrease of $6.5 million from 2Q09 3Q09 Charge-Offs of $34 million were up $9.6 million from 2Q09 Past Dues decreased $5.2 million from 2Q09 to 1.67% Re-scored on a quarterly basis: • Average Beacon Score shows no deterioration over four quarters Credit Card past dues and chargeoffs are well below industry average * Annualized 26 |
| APPENDIX 27 |
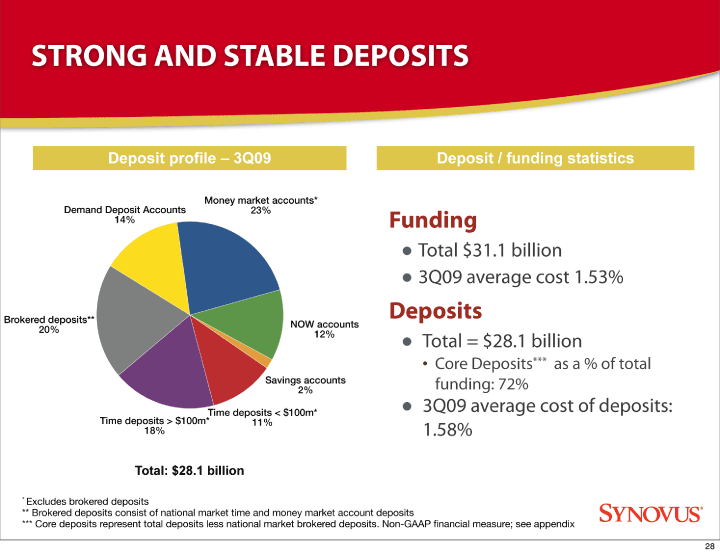
| STRONG AND STABLE DEPOSITS Deposit profile — 3Q09 Deposit / funding statistics Demand Deposit Accounts 14% Brokered deposits** 20% Time deposits > $100m* 18% Time deposits < $100m* 11% Savings accounts 2% NOW accounts 12% Money market accounts* 23% * Excludes brokered deposits ** Brokered deposits consist of national market time and money market account deposits *** Core deposits represent total deposits less national market brokered deposits. Non-GAAP financial measure; see appendix Total: $28.1 billion Funding • Total $31.1 billion • 3Q09 average cost 1.53% Deposits • Total = $28.1 billion • Core Deposits*** as a % of total funding: 72% • 3Q09 average cost of deposits: 1.58% 28 |
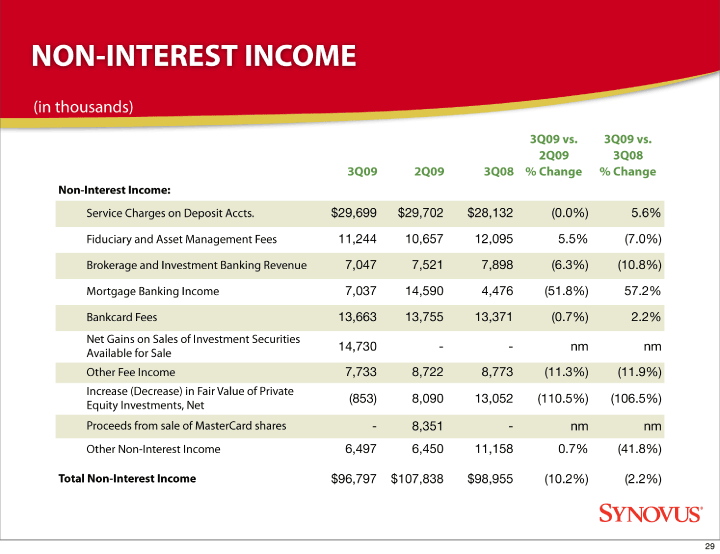
| NON-INTEREST INCOME 3Q09 2Q09 3Q08 3Q09 vs. 2Q09 % Change 3Q09 vs. 3Q08 % Change Non-Interest Income: Service Charges on Deposit Accts. $29,699 $29,702 $28,132 (0.0%) 5.6% Fiduciary and Asset Management Fees 11,244 10,657 12,095 5.5% (7.0%) Brokerage and Investment Banking Revenue 7,047 7,521 7,898 (6.3%) (10.8%) Mortgage Banking Income 7,037 14,590 4,476 (51.8%) 57.2% Bankcard Fees 13,663 13,755 13,371 (0.7%) 2.2% Net Gains on Sales of Investment Securities Available for Sale 14,730 — - nm nm Other Fee Income 7,733 8,722 8,773 (11.3%) (11.9%) Increase (Decrease) in Fair Value of Private Equity Investments, Net (853) 8,090 13,052 (110.5%) (106.5%) Proceeds from sale of MasterCard shares — 8,351 — nm nm Other Non-Interest Income 6,497 6,450 11,158 0.7% (41.8%) Total Non-Interest Income $96,797 $107,838 $98,955 (10.2%) (2.2%) (in thousands) 29 |
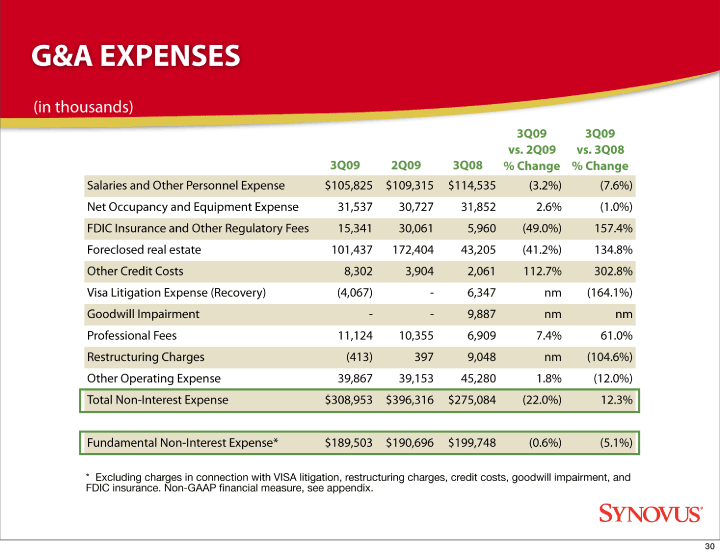
| G&A EXPENSES 3Q09 2Q09 3Q08 3Q09 vs. 2Q09 % Change 3Q09 vs. 3Q08 % Change Salaries and Other Personnel Expense $105,825 $109,315 $114,535 (3.2%) (7.6%) Net Occupancy and Equipment Expense 31,537 30,727 31,852 2.6% (1.0%) FDIC Insurance and Other Regulatory Fees 15,341 30,061 5,960 (49.0%) 157.4% Foreclosed real estate 101,437 172,404 43,205 (41.2%) 134.8% Other Credit Costs 8,302 3,904 2,061 112.7% 302.8% Visa Litigation Expense (Recovery) (4,067) — 6,347 nm (164.1%) Goodwill Impairment — - 9,887 nm nm Professional Fees 11,124 10,355 6,909 7.4% 61.0% Restructuring Charges (413) 397 9,048 nm (104.6%) Other Operating Expense 39,867 39,153 45,280 1.8% (12.0%) Total Non-Interest Expense $308,953 $396,316 $275,084 (22.0%) 12.3% Fundamental Non-Interest Expense* $189,503 $190,696 $199,748 (0.6%) (5.1%) * Excluding charges in connection with VISA litigation, restructuring charges, credit costs, goodwill impairment, and FDIC insurance. Non-GAAP financial measure, see appendix. (in thousands) 30 |
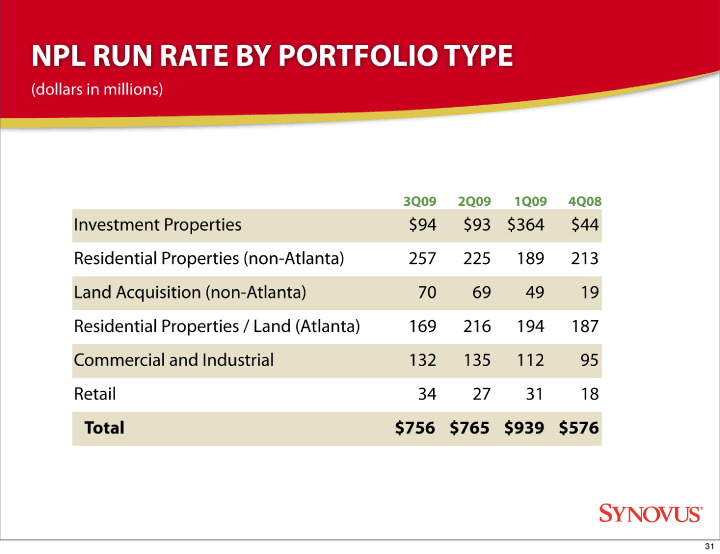
| NPL RUN RATE BY PORTFOLIO TYPE 3Q09 2Q09 1Q09 4Q08 Investment Properties $94 $93 $364 $44 Residential Properties (non-Atlanta) 257 225 189 213 Land Acquisition (non-Atlanta) 70 69 49 19 Residential Properties / Land (Atlanta) 169 216 194 187 Commercial and Industrial 132 135 112 95 Retail 34 27 31 18 Total $756 $765 $939 $576 (dollars in millions) 31 |
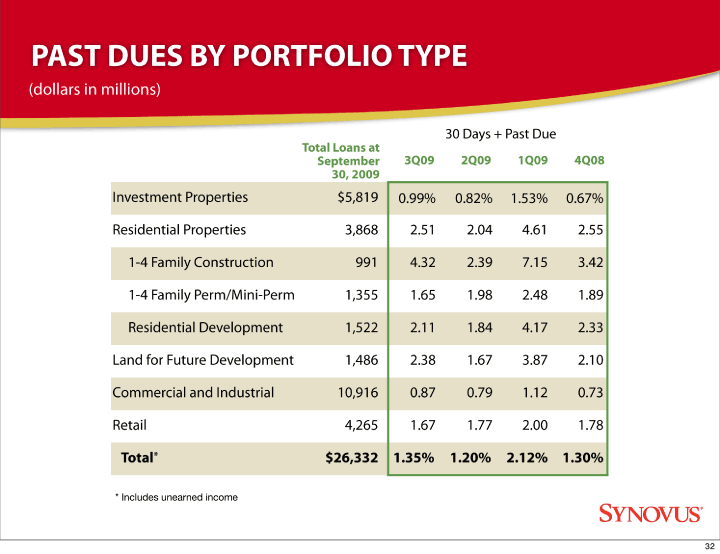
| PAST DUES BY PORTFOLIO TYPE 30 Days + Past Due Total Loans at September 30, 2009 3Q09 2Q09 1Q09 4Q08 Investment Properties $5,819 0.99% 0.82% 1.53% 0.67% Residential Properties 3,868 2.51 2.04 4.61 2.55 1-4 Family Construction 991 4.32 2.39 7.15 3.42 1-4 Family Perm/Mini-Perm 1,355 1.65 1.98 2.48 1.89 Residential Development 1,522 2.11 1.84 4.17 2.33 Land for Future Development 1,486 2.38 1.67 3.87 2.10 Commercial and Industrial 10,916 0.87 0.79 1.12 0.73 Retail 4,265 1.67 1.77 2.00 1.78 Total* $26,332 1.35% 1.20% 2.12% 1.30% (dollars in millions) * Includes unearned income 32 |
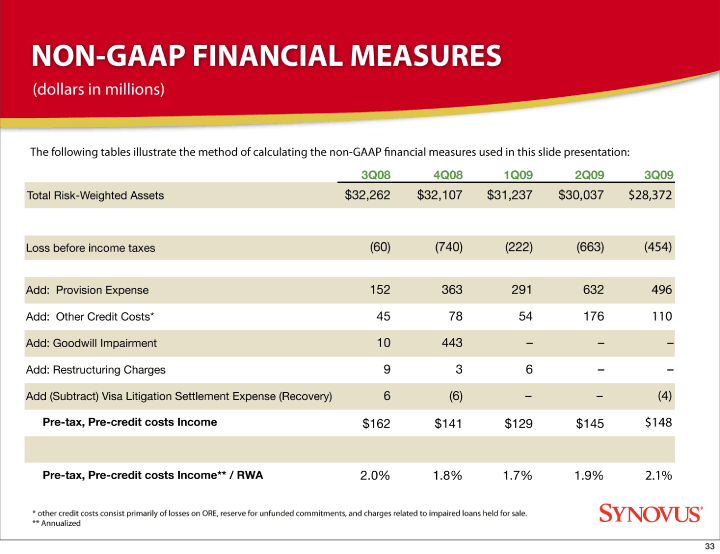
| NON-GAAP FINANCIAL MEASURES The following tables illustrate the method of calculating the non-GAAP #nancial measures used in this slide presentation: 3Q08 4Q08 1Q09 2Q09 3Q09 Total Risk-Weighted Assets $32,262 $32,107 $31,237 $30,037 $28,372 Loss before income taxes (60) (740) (222) (663) (454) Add: Provision Expense 152 363 291 632 496 Add: Other Credit Costs* 45 78 54 176 110 Add: Goodwill Impairment 10 443 — - — Add: Restructuring Charges 9 3 6 — - Add (Subtract) Visa Litigation Settlement Expense (Recovery) 6 (6) — - (4) Pre-tax, Pre-credit costs Income $162 $141 $129 $145 $148 Pre-tax, Pre-credit costs Income** / RWA 2.0% 1.8% 1.7% 1.9% 2.1% * other credit costs consist primarily of losses on ORE, reserve for unfunded commitments, and charges related to impaired loans held for sale. ** Annualized (dollars in millions) 33 |
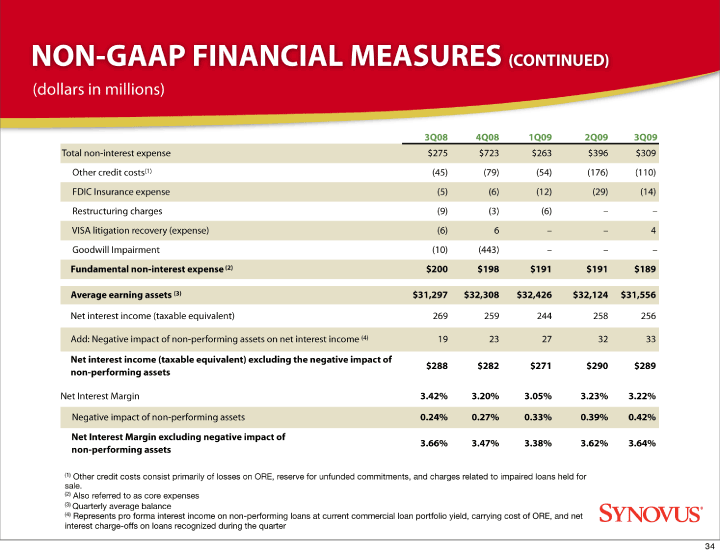
| NON-GAAP FINANCIAL MEASURES (CONTINUED) 3Q08 4Q08 1Q09 2Q09 3Q09 Total non-interest expense $275 $723 $263 $396 $309 Other credit costs(1) (45) (79) (54) (176) (110) FDIC Insurance expense (5) (6) (12) (29) (14) Restructuring charges (9) (3) (6) — - VISA litigation recovery (expense) (6) 6 — - 4 Goodwill Impairment (10) (443) — - — Fundamental non-interest expense (2) $200 $198 $191 $191 $189 Average earning assets (3) $31,297 $32,308 $32,426 $32,124 $31,556 Net interest income (taxable equivalent) 269 259 244 258 256 Add: Negative impact of non-performing assets on net interest income (4) 19 23 27 32 33 Net interest income (taxable equivalent) excluding the negative impact of non-performing assets $288 $282 $271 $290 $289 Net Interest Margin 3.42% 3.20% 3.05% 3.23% 3.22% Negative impact of non-performing assets 0.24% 0.27% 0.33% 0.39% 0.42% Net Interest Margin excluding negative impact of non-performing assets 3.66% 3.47% 3.38% 3.62% 3.64% (1) Other credit costs consist primarily of losses on ORE, reserve for unfunded commitments, and charges related to impaired loans held for sale. (2) Also referred to as core expenses (3) Quarterly average balance (4) Represents pro forma interest income on non-performing loans at current commercial loan portfolio yield, carrying cost of ORE, and net interest charge-offs on loans recognized during the quarter (dollars in millions) 34 |
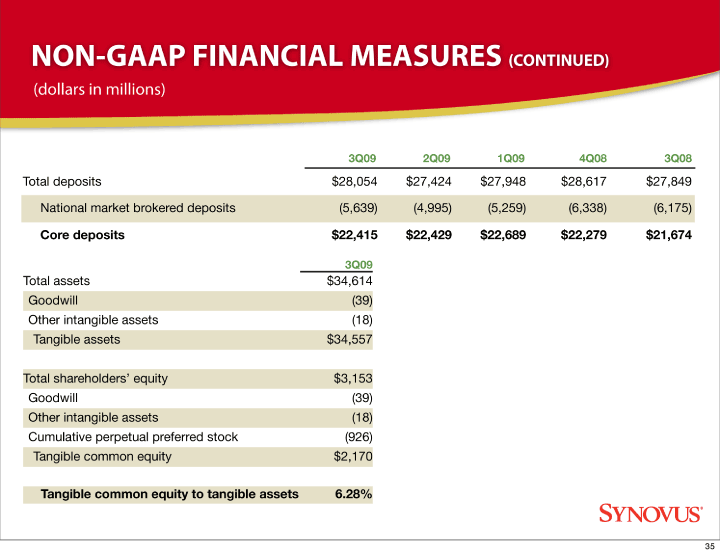
| NON-GAAP FINANCIAL MEASURES (CONTINUED) 3Q09 Total assets $34,614 Goodwill (39) Other intangible assets (18) Tangible assets $34,557 Total shareholders’ equity $3,153 Goodwill (39) Other intangible assets (18) Cumulative perpetual preferred stock (926) Tangible common equity $2,170 Tangible common equity to tangible assets 6.28% (dollars in millions) 3Q09 2Q09 1Q09 4Q08 3Q08 Total deposits $28,054 $27,424 $27,948 $28,617 $27,849 National market brokered deposits (5,639) (4,995) (5,259) (6,338) (6,175) Core deposits $22,415 $22,429 $22,689 $22,279 $21,674 35 |
