Attached files
| file | filename |
|---|---|
| 8-K - FORM 8-K - SUNTRUST BANKS INC | d8k.htm |
| EX-99.1 - NEWS RELEASE DATED OCTOBER 22, 2009 - SUNTRUST BANKS INC | dex991.htm |
 SunTrust Banks, Inc. 3Q 2009 Earnings Presentation October 22, 2009 Exhibit 99.2 |
 1 Important Cautionary Statement About Forward-Looking Statements The following should be read in conjunction with the financial statements, notes and other information
contained in the Company’s 2008 Annual Report on Form 10-K, Quarterly Reports on Form 10-Q, and Current Reports on Form 8-K. This presentation includes non-GAAP financial measures to describe SunTrust’s performance.
The reconciliation of those measures to GAAP measures are provided within or in the appendix of this presentation. In this presentation, net interest income and net interest margin are presented on
a fully taxable-equivalent (“FTE”) basis, and ratios are presented on an annualized basis. The FTE basis adjusts for the tax-favored status of income from certain loans and investments. The
Company believes this measure to be the preferred industry measurement of net interest income and provides relevant comparison between taxable and non-taxable amounts. This presentation contains forward-looking statements. Statements regarding future levels of net
interest margin, charge-offs, provision expense, FDIC and other regulatory expenses, and income are forward-looking statements. Also, any statement that does not describe historical or
current facts, including statements about beliefs and expectations, is a forward-looking statement. These statements often include the words “believes,” “expects,”
“anticipates,” “estimates,” “intends,” “plans,” “targets,” “initiatives,” “potentially,” “probably,” “projects,” “outlook” or similar expressions or future conditional verbs such as “may,” “will,” “should,”
“would,” and “could.” Such statements are based upon the current beliefs and expectations of management and on information currently available to management. Our forward looking statements speak as of the date hereof,
and we do not assume any obligation to update these statements or the reasons why actual
results could differ from those contained in such statements in light of new information or future events. Forward-looking statements are subject to significant risks and uncertainties. Investors are cautioned
against placing undue reliance on such statements. Actual results may differ materially from those set forth in the forward-looking statements. Factors that could cause actual results to differ
materially from those described in the forward-looking statements can be found at Item 1A of our annual report on Form 10-K filed with the Securities and Exchange Commission and available at the
Securities and Exchange Commission’s internet site (http://www.sec.gov). Those factors include: difficult market conditions have adversely affected our industry; current levels of market
volatility are unprecedented; the soundness of other financial institutions could adversely affect us; there can be no assurance that recently enacted legislation, or any proposed federal programs, will
stabilize the U.S. financial system, and such legislation and programs may adversely affect us;
the impact on us of recently enacted legislation, in particular the Emergency Economic Stabilization Act of 2008 (“EESA”) and its implementing regulations, and actions by the FDIC, cannot be predicted at this time; credit risk; weakness in the economy and in the real estate market, including
specific weakness within our geographic footprint, has adversely affected us and may continue
to adversely affect us; weakness in the real estate market, including the secondary residential mortgage loan markets, has adversely affected us and may continue to adversely affect us; weakness in the real estate market may adversely affect our reinsurance subsidiary; as a financial
services company, adverse changes in general business or economic conditions could have a
material adverse effect on our financial condition and results of operations; changes in market interest rates or capital markets could adversely affect our revenue and expense, the value of assets and obligations, and the availability and cost of capital or liquidity; the fiscal and monetary
policies of the federal government and its agencies could have a material adverse effect on our earnings; we may be required to repurchase mortgage loans or indemnify mortgage loan purchasers as a result
of breaches of representations and warranties, borrower fraud, or certain borrower defaults,
which could harm our liquidity, results of operations, and financial condition; clients could pursue alternatives to bank deposits, causing us to lose a relatively inexpensive source of funding; consumers may decide not to use banks to complete their financial transactions, which could affect
net income; we have businesses other than banking which subject us to a variety of risks;
hurricanes and other natural disasters may adversely affect loan portfolios and operations and increase the cost of doing business; negative public opinion could damage our reputation and adversely impact our business and revenues; we rely on other companies to provide key components of our
business infrastructure; we rely on our systems, employees, and certain counterparties, and
certain failures could materially adversely affect our operations; we depend on the accuracy and completeness of information about clients and counterparties; regulation by federal and state agencies could adversely affect our business, revenue, and profit margins; competition in
the financial services industry is intense and could result in losing business or reducing margins; future legislation could harm our competitive position; maintaining or increasing market share
depends on market acceptance and regulatory approval of new products and services; we may not
pay dividends on our common stock; our ability to receive dividends from our subsidiaries accounts for most of our revenue and could affect our liquidity and ability to pay dividends; significant legal actions could subject us to substantial uninsured liabilities; recently declining values
of residential real estate, increases in unemployment, and the related effects on local economics may increase our credit losses, which would negatively affect our financial results;
deteriorating credit quality, particularly in real estate loans, has adversely impacted us and may continue to adversely impact us; disruptions in our ability to access global capital markets may negatively
affect our capital resources and liquidity; any reduction in our credit rating could increase the cost of our funding from the capital markets; we have in the past and may in the future pursue
acquisitions, which could affect costs and from which we may not be able to realize anticipated benefits; we depend on the expertise of key personnel, if these individuals leave or change their roles
without effective replacements, operations may suffer; we may not be able to hire or retain additional qualified personnel and recruiting and compensation costs may increase as a result of turnover,
both of which may increase costs and reduce profitability and may adversely impact our ability
to implement our business strategy; our accounting policies and processes are critical to how we report our financial condition and results of operations, and these require us to make estimates about matters that are uncertain; changes to our accounting policies or in accounting standards
could materially affect how we report our financial results and condition; our stock price can
be volatile; our disclosure controls and procedures may not prevent or detect all errors or acts of fraud; our financial instruments carried at fair value expose us to certain market risks; our revenues derived from our investment securities may be volatile and subject to a variety of risks; we may
enter into transactions with off-balance sheet affiliates or our subsidiaries; and we are subject to market risk associated with our asset management and commercial paper conduit businesses.
|
 2 I. HIGHLIGHTS II. CAPITAL III. FINANCIAL PERFORMANCE IV. RISK REVIEW V. APPENDIX Table of Contents |
 3 Third Quarter Highlights • EPS loss of $0.76 includes $0.16 per share of fair value debt charges and reflects the
continued challenging economic and credit environments • Solid capital position with estimated Tier 1 Common Ratio of 7.45% and Tier 1 Ratio of
12.55% • Growth in consumer and commercial deposits moderated; however, positive shift in mix
continued • Average earning assets and loan balances declined as client demand remained weak
• Overall revenue and noninterest income remained cyclically soft; however, margin and net interest income increased sequentially, in part due to increased client deposits and improved
mix • Expenses continued to be well managed with compensation and other controllable expenses
declining while cyclical expenses, including FDIC and pension, continued to
impact results • Credit losses increased as anticipated; however, early stage delinquency and nonperforming
loans were stable compared to 2Q 2009 • In addition to encouraging core business trends, we believe our focus on risk mitigation,
efficiency, and executing client driven initiatives will deliver steadily
improving results as the operating environment improves I. HIGHLIGHTS |
 4 3Q
2009 2Q 2009 1Q 2009 Estimate
Actual Actual Capital Ratios Remained Solid Tier 1 Common Ratio Tier 1 Capital Ratio Tier 1 Capital Ratio (Excl TARP) Total Capital Ratio Book Value per Share Tangible Common Book Value per Share Capital Ratios II. CAPITAL 7.34% 12.23% 9.11% 15.31% $36.16 $23.41 1. TARP preferred included in Tier 1 ratio contributes an estimated 3.27% to the 9/30/09 Tier 1 capital ratio, 3.12% at 6/30/09, and 3.00% at 3/31/09 2. Please refer to the appendix to this presentation for a reconcilement to the most
directly comparable GAAP financial measure 7.45% 12.55% 9.28% 15.90% $36.06 $23.35 5.83% 11.02% 8.02% 14.15% $46.03 $28.15 2 1 |
 5 ($ in millions, except per share data) Results Reflect Sustained Economic Pressures Income Statement Highlights III. FINANCIAL PERFORMANCE Net Interest Income (FTE) Provision for Loan Losses Noninterest Income Total Revenue (FTE) Total Noninterest Expense Total Noninterest Expense Excl Goodwill Charge Pre-Tax Loss Provision/(Benefit) for Income Taxes Preferred Dividends Gain on Redemption of Preferred Stock Net Loss Available to Common Shareholders Net Loss Per Share Excluding Goodwill Charge Net Loss Per Average Common Diluted
Share Net Loss Per Share Excl Goodwill Charge NM = Not Meaningful—those
changes over 1000% or where results changed from positive to negative %
Change % Change % Change 3Q 2009 2Q 2009 3Q
2008 YTD 2009 YTD 2008 1. Please refer to the appendix to this presentation for a reconcilement to the most
directly comparable GAAP financial measure $1,168.2 1,133.9 775.1 1,943.2 1,428.8
1,428.8
(653.0) (336.1) 68.2
4.9 (377.1) (377.1) (0.76) (0.76) 4%
18% (28)%
(11)% (6)%
(6)%
(96)%
(126)% (6)%
(95)% (129)% (129)% (85)% (85)% (1)% 125% (40)%
(21)% (14)%
(14)%
NM
537% NM
NM NM NM NM NM $3,382.2 3,090.2 2,968.0
6,350.2 5,108.8
4,357.7
(1,951.4) (635.8) 211.7
94.3 (1,417.0) (702.1) (3.41) (1.69) (4)% 104% (21)% (13)% 19% 3% NM NM NM NM NM NM NM NM 1 1 1 |
 6 ($ in millions, quarterly average balances) Balance Sheet Summary Commercial Real Estate Home Equity Lines Real Estate Construction Real Estate 1-4 Family Real Estate Commercial Consumer – Direct Consumer – Indirect Credit Card Total Loans Noninterest-Bearing Deposits NOW Accounts Money Market Accounts Savings Consumer Time Other Time Total Consumer and Commercial Deposits
Brokered & Foreign Deposits
Total Deposits 3Q 2009 2Q 2009 2Q 2009 3Q 2008 Annualized % Change III. FINANCIAL PERFORMANCE 1. Excludes $6.5 billion of nonaccrual and restructured loans Deposit Growth Slowed, Though Mix Improved; Loan Demand Remained Weak $35,410 15,611 5,421 28,398
15,820 5,042 6,617 990 $113,309 $24,516
23,956 32,505 3,733 16,735 13,041 114,486 5,193 $119,679 (8)% (1)% (16)% 0% (2)% 2% 1% (4)% 5% 4% 2% (4)% (6)% 1% (21)% 0% (33)% (5)% (64)% (13)%
1% (7)% 7% 5% (18)% 21% 16% 8% (15)% (25)% 3% (86)% (2)% 1 (3)% (7)% 1% (48)% 12% 7% (7)% 15% (7)% 17% 21% (1)% 3% 10% 14% (67)% 3% (10)% (13)% (1)% 17% 0% |
 7 U.S. Treasury U.S. Agency U.S. States and Subdivisions MBS – Agency MBS – Private Corporate & Other Other Equity Total AFS High Quality Securities Portfolio Increased Due To Strong Liquidity 3Q
2009 2Q
2009 $ Change Securities Available for Sale ($ in millions, period end balance) Securities Portfolio III. FINANCIAL PERFORMANCE $953 3,975 1,000 12,464 417 801 2,513 $22,123 $191 389 1,004 14,386 440 619 2,436 $19,465 $762 3,586 (4) (1,922) (23) 182 77 $2,658 |
 8 3.07% 3.14% 2.87% 2.94% 3.10% 3Q 2008 4Q 2008 1Q 2009 2Q 2009 3Q 2009 Margin Expanded 16 bps from 2Q 2009
• 3Q margin expansion driven primarily by improved deposit pricing and funding mix, with increased core deposits and decreased broker deposits and long-term debt • Focus on deposit and loan pricing benefited margin and offset compression associated with NPA’s and sluggish loan demand • Based on current trends and assumptions, modest additional margin expansion in 4Q is expected Net Interest Margin III. FINANCIAL PERFORMANCE |
 9 ($ in millions) Higher Provision Expense Driven by Charge-Offs; Growth in ALLL Continued to Slow
Provision For Loan Loss III. FINANCIAL PERFORMANCE Provision Net Charge-offs Net Charge-off Ratio Net ALLL Increase Allowance to Loan Ratio $994.1 $610.1 1.97% $384.0 2.21%
3Q 2009 2Q
2009 1Q 2009 4Q 2008 $962.5 $552.5 1.72% $410.0 $503.7 $392.1 1.24% $111.6 $962.2 $801.2 2.59% $161.0 2.37%
$1,133.9 $1,005.9 3.33% $128.0 2.61%
1.54% 1.86% 3Q 2008 |
 10 (40)% (15)% Noninterest Income Net Adjustments Adjusted Noninterest Income ($ in millions) Noninterest Income Remained Cyclically Soft; $136 Million Impact from Mortgage Repurchase Reserves in the Quarter 1. Adjustment detail included in appendix includes securities gains and
losses 2. Please refer to the appendix to this presentation for a reconcilement to the most directly comparable GAAP financial measure Noninterest Income III. FINANCIAL PERFORMANCE % Change 3Q 2009 2Q
2009 3Q 2008 2Q 2009 3Q 2008 $775 (70) $845 $1,072 145 $927 $1,285 286 $999 (28)% (9)% 1 2 |
 11 (14)% (4)% $(63) (67) 27 26 $(14) $(49) Expense Results Noninterest Expense Net Adjustment Adjusted Noninterest Expense Expense Driver Analysis Total Adjusted Incr/(Decr) Credit Related Costs FDIC (Excl Special
Assessment) Pension
Subtotal of Expense Drivers Net Expense Incr/(Decr) Excl Drivers Controllable Expenses Well Managed; Economically Cyclical Expenses Continued to Impact
Results 1. Adjustment detail included in appendix 2. Includes operating losses, credit and collections, other real estate expense,
additions to mortgage re-insurance reserves and unfunded commitment reserve, but does not include additional personnel expense related to credit
administration or default management. Change 3Q 2009 2Q
2009 3Q 2008 2Q 2009 3Q 2008 % ($ in millions) Noninterest Expense III. FINANCIAL PERFORMANCE $
Change $1,429 33 $1,396 215 46 28 $1,528 124 $1,404 171 71 31 $1,665 206 $1,459 282 19 2 (6)% (1)% $(8) 44 (25) (3) $16 $(24)
1 2 |
 12 Asset Quality Metrics IV. RISK REVIEW Increased Credit Losses from Construction, Mortgage and C&I Portfolios; NPL, NPA and
30-89 DPD Balances Stable versus 2Q 2009 ($ in millions) 3Q 2009 2Q 2009 1Q 2009 3Q09 vs 2Q09 2Q09 vs 1Q09 Total Loans at End of Period $116,487.9 $122,816.2 $123,893.0 -$6,328.3 -$1,076.8 Allowance for Loans & Lease Losses 3,024.0 2,896.0 2,735.0 128.0 161.0 Net Charge-offs 1,005.9 801.2 610.1 204.7 191.1 Provision Expense 1,133.9 962.2 994.1 171.7 -31.9 NPAs 6,094.8 6,165.0 5,246.4 -70.2 918.6 NPLs to Total Loans 4.67% 4.48% 3.75% 0.19% 0.73% NPAs to Total Loans + OREO/OA 5.20% 4.99% 4.21% 0.21% 0.78% ALLL to Loans 2.61% 2.37% 2.21% 0.24% 0.16% NCOs (annualized to Average Loans) 3.33% 2.59% 1.97% 0.74% 0.62% 30-89 Days Past Due 1.52% 1.54% 1.76% -0.02% -0.22% |
 13 Loan Portfolio IV. RISK REVIEW 1. Consumer - Direct includes approximately $3 billion of federally guaranteed student loans
The Majority of Asset Quality Issues Continued to be Driven by the Residential Real
Estate Secured Portfolios Balance % of Balance % of C/O Ratio C/O Ratio 30-89 DLQ% 30-89 DLQ% ($ in millions) 09/30/2009 Portfolio 06/30/2009 Portfolio 3Q09 2Q09 3Q09 2Q09 Commercial $33,492 29% $37,961 31% 2.15% 1.53% 0.43% 0.27% Commercial Real Estate 15,294 13% 15,859 13% 0.51% 0.07% 0.84% 0.85% Consumer - Direct (1) 5,059 4% 5,121 4% 1.41% 0.91% 4.67% 4.25% Consumer - Indirect 6,564 6% 6,406 5% 1.50% 1.24% 1.51% 1.66% Credit Cards 957 1% 1,006 1% 9.39% 9.03% 3.38% 3.72% Real Estate Home Equity Lines 16,121 14% 16,298 13% 4.51% 4.79% 1.45% 1.38% Real Estate 1-4 Family 31,623 27% 31,989 26% 4.92% 4.06% 2.23% 2.50% Real Estate Construction 7,380 6% 8,176 7% 8.83% 4.20% 2.63% 3.36% Total $116,488 100% $122,816 100% 3.33% 2.59% 1.52% 1.54% |
 14 40% 34% 1% 11% 5% 6% 3% Unsecured: 40% Receivables: 34% Assignments of Contracts and Intangibles:11% Deposits, CSV, Securities, Letters of Credit: 5% Equipment (Business/Commercial): 6% Inventory: 3% Residential Property: 1% 38% 34% 28% Mid-Atlantic Group Central Group Florida Group IV. RISK REVIEW C&I Portfolio 1. Excludes leasing portfolio 2. Excludes large corporate client portfolio and leasing portfolio
Well Diversified C & I Portfolio 14% 12% 11% 10% 9% 8% 7% 7% 7% 6% 6% 4% Consumer Products & Svcs: 14% Retailing: 12% Gov, Relig. & Non Profit:11% Div. Fin. & Ins: 10% Energy & Utilities: 9% Health Care & Pharma: 8% Div. Com. Svcs: 7% Other: 7% Capital Goods: 7% Real Estate: 6% Media & Telecom: 6% Materials: 4% Client Segment Geography Collateral Type Industry Group 32% 16% 8% 5% 39% Commercial Large Corporate Leasing Wealth Management Small Business 1 2 1 |
 15 Central Group 33% Mid-Atlantic Group 44% National 5% Florida Group 18% Investor Owned 41% Owner Occupied 59% 41% Investor Owned Portfolio is Well Diversified IV. RISK REVIEW Commercial Real Estate Portfolio Geography 4,764 1,240 54 18 12 0 1,000 2,000 3,000 4,000 5,000 <$1MM $1MM- 10MM $10MM- 20MM $20MM- 30MM >$30MM # of Loans $1.0 Million Avg Loan Size Granularity Retail 24% Office 20% Multifamily 18% Warehouse/ Industrial 15% Special Purpose Real Estate 15% Hotels/ Motels 8% Property Type |
 16 1. Excludes $60 million of mark-to-market loans held for sale in Q3 2009
and $65 million in Q2 2009. 2. Does not include nonaccruals Residential Mortgages $31,623 million Residential Mortgages IV. RISK REVIEW Delinquencies Stabilized While Growth in Nonaccruals Moderated; Florida Remains the Trouble
Spot for this Portfolio ($ in millions) Portfolio Profile Credit Quality Metrics Loan Type 9/30/09 Balance 6/30/09 Balance 9/30/2009 $ Nonaccruals 6/30/2009 $ Nonaccruals 9/30/09 60+ DLQ 6/30/09 60+ DLQ Core Portfolio $24,306 $ 24,314 $1,855 $1,683 1.71% 1.92% Home Equity Loans 2,227 2,382 65 71 1.16 0.99 Prime 2 3,065 3,210 96 120 2.92 2.58 Lot Loans 1,162 1,157 278 280 5.50 5.33 Alt-A 1 637 694 254 259 8.65 7.84 Alt-A 2 226 232 38 51 9.99 8.76 Total $31,623 $31,989 $2,586 $2,464 2.28% 2.34% 1 1 2 2 nd nd st |
 17 Home Equity Lines $16,121 million 1. Excludes 3 party originated 2. Excludes 3rd party originated and Florida CLTV > 80% 3. Excludes 3rd party originated, Florida CLTV>80% and CLTV 90+% 4. Annualized quarterly rate Portfolio Profile Credit Quality Metrics Type 9/30/09 Balance % of Total 6/30/09 Balance 3Q 09 Charge-off 4 % 2Q 09 Charge-off 4 % 3Q 09 Nonaccrual % 2Q 09 Nonaccrual % 3 Party Originated $1,630 10% $1,703 12.56% 13.75% 4.04% 4.41% CLTV > 80% (Florida) 1,839 11 1,892 9.97 10.32 3.18 3.68 CLTV > 90% 1,597 10 1,644 4.78 4.54 1.56 1.84 All Other 11,055 69 11,059 2.25 2.35 1.23 1.20 Total $16,121 100% $16,298 4.51% 4.79% 1.74% 1.91% Home Equity Lines IV. RISK REVIEW Charge-Offs and Nonaccruals Declined in 3Q 2009 for nearly all HELOC portfolio
segments ($ in millions) rd 1 2 3 rd |
 18 1. Annualized third quarter net charge-off ratio ($ in millions) Construction Balances Continued Rapid Decline to 6% of Total Loans; Residential Builder
Charge-Offs Increased Significantly Construction $7,380 million 19 14% % of Portfolio 4.87% 7.76 1.00 0.74 2.79 7.73 7.91 5.57% 2Q 09 30 + DLQ Portfolio Profile Credit Quality Metrics Type 9/30/09 Balance % FL 3Q 09 C/O % $ NPLs FL NPLs % 3Q 09 30 + DLQ Construction Perm $1,029 27% 7.70% $297 36% 4.82% Residential Construction 1,373 29 7.76 481 44 5.51 Residential A&D 1,446 20 21 21.85 486 29 7.01 Residential Land 527 7 39 16.01 186 48 4.49 Commercial Construction 2,016 27 19 0.59 78 64 1.30 Commercial A&D 471 6 23 0.75 16 52 3.67 Commercial Land 518 7 30 0.92 38 21 7.20 Total $7,380 100% 25% 8.83% $1,582 39% 4.49% IV. RISK REVIEW Construction 1 |
  19 Allowance to Nonperforming Loan Review ALLL Coverage of NPLs Increases to 109% When Adjusted for NPLs Previously Written Down and
Impaired Loans With Specific Reserve Allocations IV. RISK REVIEW ($ in millions, period end balances) IMPAIRED COMMERCIAL LOANS WITH SPECIFIC RESERVES 3Q 2009 9/30/09 9/30/09 FAS114 Cumulative Balance Reserve Charge-Offs Implied Severity Commerical and Investment Banking $273 $55 $176 52% Commercial 1,013 202 147 30% Wealth & Investment Management 15 - 2 10% Commercial FAS 114 Portfolio $1,301 $258 $326 36% ALLL / NPL Coverage Ratio 20% 57% 109% 32% Base ALLL/NPL Coverage¹ Res Mtg Previously Written Down² Impaired CML Loans With Specific Reserves Adjusted ALLL/NPL Coverage 1. Base ALLL/NPL coverage ratio excludes $108 million in nonaccrual loans held at fair value
2. Adjustments include reducing the denominator of the ratio for the carrying value of residential
mortgages previously written-down and those not requiring a write-down (Appendix slide 26), and a $277 million reduction in the numerator for reserves attributed to these nonperforming loans for
lower collateral values that have occurred since the FFIEC write-down at 180 DPD. |
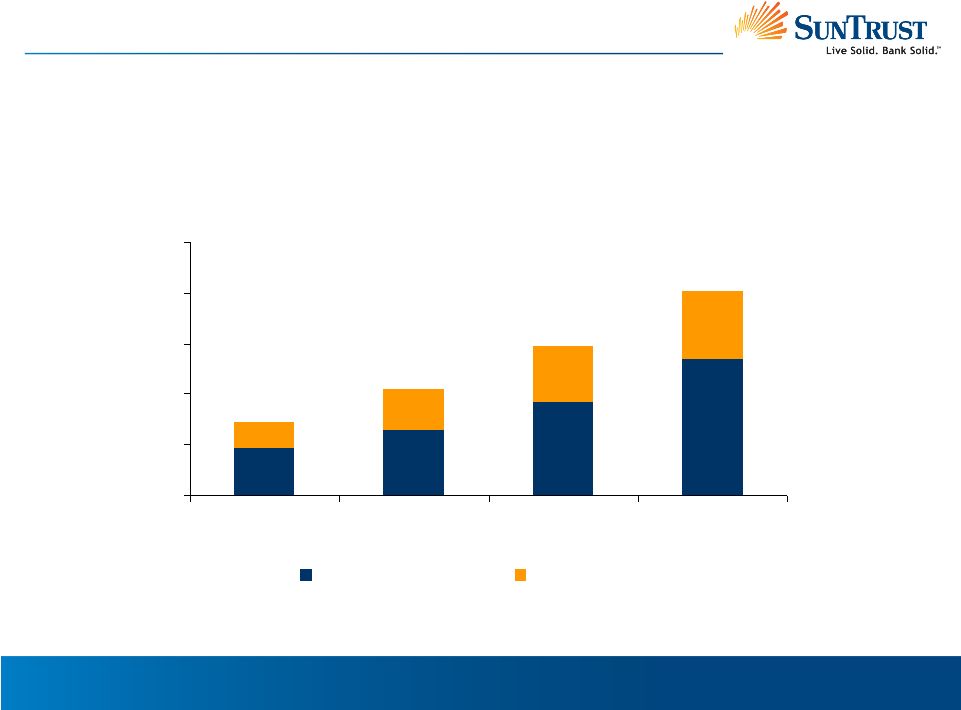 20 0 500 1,000 1,500 2,000 2,500 4Q 2008 1Q 2009 2Q 2009 3Q 2009 Accruing TDRs Nonaccruing TDRs TDR Trends IV. RISK REVIEW Pace of Mortgage Modifications Has Increased $731 $1,049 $1,477 $2,021 ($ in millions, period end balances) |
 21 Credit Summary IV. RISK REVIEW • Overall, credit quality remains weak with steady results in key credit indicators for the 3 quarter • Balances were stable for nonperforming loans, nonperforming assets and early stage
delinquencies, while net charge-offs increased driven by the Construction,
Mortgage and C&I portfolios • The Allowance for Loan and Lease Losses (ALLL) increased to 2.61% of loans • Residential Mortgage delinquencies declined, while nonaccrual balances trended
higher • The Construction portfolio declined nearly 10% – $796 million – in 3Q 2009 and is down 46% since December 2007 Construction-to-Perm stabilized Residential Construction credit performance remained weak Commercial Construction continues to perform well • ALLL coverage of NPLs is nearly 109% adjusted for Residential Mortgage NPLs that have had
write- downs and specific (FAS114) reserves • Continued improvements in delinquencies combined with stable nonperforming loans are
encouraging relative to future credit losses • Credit losses are expected to remain elevated for the next quarter or two given continued
weakness in residential real estate-related and cyclically sensitive
commercial exposures. At the current time, we do not expect a significant
increase or decrease in charge-offs in 4Q. Depending on the strength and pace of economic recovery, we currently expect improvement in the second half of
2010 rd |
 22 Appendix |
 23 ($ in millions) Total Noninterest Income Securities Gains/(Losses) VISA Gain Transplatinum Gain Fair Market Write-downs – Trading STI Debt Valuation-Trading Fair Value Write-downs – Mortgage Prod Fair Value Write-downs – Other Income ARS Reserve - Trading
MSR (Impairment)/Recovery – Mtg Svcing Net Adjustments Adjusted Noninterest Income Noninterest Income Reconciliation V. APPENDIX %
% Change Change 3Q 2009 2Q 2009 3Q
2008 2Q 2009 3Q 2008 $1,072 (25) 112 - (1) (96) (4) - 2 157 145 $927 $1,285 173 - 82 (113) 341 (17) (7) (173) - 286 $999 (28)% (9)% (40)% (15)% $775 47 - - 14 (131) (11) - 11 - (70) $845 |
 24 Total Noninterest Expense Net E Nonrecurring Visa Litigation Accrual Coke Charitable Contribution AHG Write-down (Other Expense) Net Loss/(Gain) on Debt Extinguishment FDIC Special Assessment Net Adjustments Net Total Change 3Q 2009 2Q
2009 3Q 2008 2Q 2009 3Q 2008 % ($ in millions) Noninterest Expense Reconciliation V. APPENDIX $1,528 - 7 - - 39 78 124 $1,404 $1,429 - - - 31 2 - 33 $1,396 $1,665 3 20 183 - - - 206 $1,459 (6)% (1)% (14)% (4)% 2 |
 25 Noninterest Income Mortgage Repurchase Reserve FV MSR Hedging-Trading FV MSR Hedging-Mortgage Servicing Noninterest Expense Unfunded Commitment Reserve (Other Exp) Mortgage Reinsurance Operating Losses Credit & Collections Other Real Estate Total Credit-Related Additional Noninterest Income and Expense Disclosures V. APPENDIX $ Change 3Q 2009 2Q
2009 3Q 2008 2Q 2009 3Q 2008 ($ in millions) $(135.6) (13.2) 13.2 29.1 10.0 18.4 69.1 88.3 $214.9 $73.6 8.6 (8.6) 30.7 (14.6) (14.2) 2.8 39.3 $44.0 $(62.0) (4.6) 4.6 (1.6) 24.6 32.6 66.3 49.0 $170.9 $(12.9) - - 16.2 48.0 135.2 50.6 32.3 $282.3 $122.7 (13.2) 13.2 12.9 (38.0) (116.8) 18.5 56.0 $(67.4) |
 26 (As of 09/30/09, $ in millions) 1. Reserves have been established for residential mortgage loans that have not had
specific write-downs as well as for incremental losses on loans carried at expected recoverable values 2. Nonaccruals not requiring write-downs include well-secured loans and loans
with claims in process for individual and pool PMI policies 3. Excludes Home
Equity nonaccruals of $65 million, $60 million of mark-to-market loans held for sale and $91 million of residential real estate loans managed on commercial system Nonaccruals that have been through the specific write-down process Loan Type Balance before write- down - Amount of write- down = Non accruals
with accruals not write-down + Non requiring write-down + Non accruals without specific write-down = Total Non accruals % Loss Severity Core Portfolio $1,328 $(438) $890 $346 $528 $1,764 26.2% Prime 2 348 (348) -- 96 -- 96 -- Lot Loans 348 (182) 166 56 56 278 45.2% Alt-A 1 178 (54) 124 53 77 254 23.3% Alt-A 2 119 (105) 14 -- 24 38 88.4% Total $2,321 $(1,127) $1,194 $551 $685 $2,430 Residential Mortgages Nonaccrual Balances Increased, but 72% of Nonaccruals Have Been Through the Write-Down
Process (1) VI. APPENDIX nd nd st 2 3 |
 27 V. APPENDIX ($ in thousands, except per share data) Reconciliation of Non GAAP Measures September 30 June 30 September 30 2009 2009 2008 Total shareholders'
equity $22,908,284 $22,953,158 $18,069,378 Goodwill, net of deferred
taxes (6,204,954) (6,213,243) (7,062,869) Other intangible assets including MSRs, net of deferred taxes (1,559,765) (1,468,209) (1,328,055) MSRs 1,422,716 1,322,322 1,150,013 Tangible
equity 16,566,281 16,594,028 10,828,467 Preferred stock (4,911,416) (4,918,863) (500,000) Tangible common equity $11,654,865 $11,675,165 $10,328,467 Total
assets $172,717,747 $176,734,971 $174,776,760 Goodwill
(6,314,382) (6,314,382) (7,062,869) Other intangible assets including
MSRs (1,604,136) (1,517,483) (1,389,965) MSRs 1,422,716 1,322,322 1,150,013 Tangible
assets $166,221,945 $170,225,428 $167,473,939 Tangible equity to tangible assets 9.96 % 9.75 % 6.47 % Tangible book value per common share $23.35 $23.41 $29.18 Three Months Ended |
 28 V. APPENDIX Reconciliation of Non GAAP Measures ($ in thousands, except per share data) September 30 June 30 September 30 September 30 September 30 2009 2009 2008 2009 2008 Total noninterest expense $1,428,847 $1,527,972 $1,665,295 $5,108,842 $4,292,870 Goodwill/intangible impairment charges other than MSRs - - - 751,156 45,000 Total noninterest expense excluding goodwill/intangible impairment charges
other than MSRs $1,428,847 $1,527,972 $1,665,295 $4,357,686 $4,247,870 Net income/(loss) ($316,941) ($183,460) $312,444 ($1,315,568) $1,143,361 Goodwill/intangible impairment charges other than MSRs, after tax
- - - 723,853 27,281 Net income/(loss) excluding goodwill/intangible impairment charges other than MSRs, after tax
($316,941) ($183,460) $312,444 ($591,715) $1,170,642 Net income/(loss) available to common shareholders ($377,144) ($164,428) $304,397 ($1,416,953) $1,115,920 Goodwill/intangible impairment charges other than MSRs attributable to
common shareholders, after tax - - - 714,824 27,006 Net income/(loss) available to common shareholders excluding
goodwill/intangible impairment charges
other than MSRs, after tax ($377,144) ($164,428) $304,397 ($702,129) $1,142,926 Net income/(loss) per average common share, diluted ($0.76) ($0.41) $0.87 ($3.41) $3.19 Impact of excluding goodwill/intangible impairment charges other than MSRs
attributable to common shareholders,
after tax - - - 1.72 0.08 Net income/(loss) per average diluted common share,
excluding goodwill/intangible
impairment charges other than MSRs, after tax ($0.76) ($0.41) $0.87 ($1.69) $3.27 SUPPLEMENTAL INCOME STATEMENT RECONCILIATION Net income/(loss) ($316,941) ($183,460) $312,444 ($1,315,568) $1,143,361 Preferred dividends, Series A (1,763) (5,635) (5,111) (12,398) (17,200) U.S. Treasury preferred dividends (66,439) (66,546) - (199,264) - Dividends and
undistributed earnings allocated to unvested shares 3,106
1,788 (2,936) 15,959 (10,241) Gain on purchase of Series A preferred stock 4,893 89,425 - 94,318 - Net income/(loss)
available to common shareholders ($377,144) ($164,428) $304,397 ($1,416,953) $1,115,920 Three Months Ended Nine Months Ended |