Attached files
| file | filename |
|---|---|
| 8-K - FORM 8-K - MOSAIC CO | d8k.htm |
Exhibit 99.1

P&K Outlook:
The Beginning of the Demand Recovery
 |
The magnitude of the declines in phosphate (P) and potash (K) demand last year surprised market analysts. Some of the recent statistics are staggering. For example, global potash producers reported that shipments during the first half of 2009 plunged 63% from a year earlier. Shipments of the main phosphate and potash products into North American distribution channels plummeted 39% and 50%, respectively, in 2008/09 or to the lowest levels ever recorded during the modern era of production agriculture. | |
|
P&K demand declined sharply in response to record high and extremely volatile prices last year. Farmers tested their soils and cut application rates if tests revealed significant inventories in their fields. Shipments declined even more than use. Distributors emptied bins to meet demand and delayed restocking warehouses due to uncertain demand prospects, expectations of lower prices and more cautious procurement practices. | ||
|
Market Mosaic is a quarterly newsletter published for our customers, suppliers and stakeholders by the Market Analysis group of The Mosaic Company. The spring and fall issues recap our assessment of the near term outlook for agricultural and crop nutrient markets. The summer and winter issues provide an in-depth look at topics of special interest to our readers. |
Despite the extraordinary declines last year, we project a strong recovery in P&K demand during the 2009/10 fertilizer year. Several agronomic and economic factors are expected to drive the recovery. Bumper crops during the last two years have removed large amounts of P&K from soils and farmers will need to replace these nutrients in order to maintain soil fertility. We expect that farmers will return to more standard agronomic practices this year. In fact, a few early reports from the western Corn Belt indicate that P&K application rates are ‘returning to normal levels’ this fall. | |
|
A number of positive economic developments also are expected to spur the recovery. Agricultural commodity prices for the next three years continue to trade at relatively high levels due to strong underlying fundamentals. P&K prices also have recalibrated and the distribution pipeline has reset. Relatively high new crop prices coupled with lower costs for crop nutrients as well as other inputs produce moderate to highly profitable farm returns in most parts of the world. | ||
|
The speed and ultimate strength of this recovery, however, still will depend on a number of largely unpredictable variables such as macroeconomic conditions, government policies, price expectations and, of course, weather. Nevertheless, the second half of 2009 is expected to mark the beginning of the recovery – a recovery that is forecast to pick up momentum heading into the first half of 2010. | ||
| Michael R. Rahm |
Global Economic Upturn | |
| Vice President mike.rahm@mosaicco.com
Joseph Fung Market Analyst joseph.fung@mosaicco.com
Mathew Philippi Market Analysis Assistant matt.philippi@mosaicco.com |
One of the drivers of this recovery is the expected upturn in the global economy. IHS Global Insight, a leading macroeconomic forecasting company, declared last month that the Great Recession was over. They estimate that the global economy grew slightly in the second quarter of 2009 due to strong upturns in key Asian economies and less severe declines in many developed economies including the United States and Europe. | |
|
After contracting 2.2% this year, IHS Global Insight forecasts that the global economy will expand 2.5% in 2010 or at a pace only slightly less than the 2.9% compound annual growth |
— continued inside
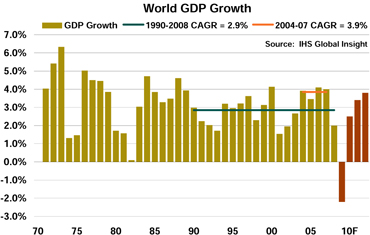
rate since 1990. Growth is projected to accelerate after 2010 to about the same fast pace of 3.9% achieved during the middle of this decade.
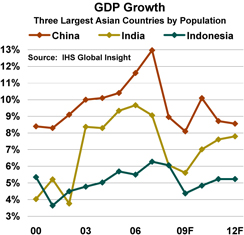
The large and rapidly developing countries in Asia are leading the recovery. It now looks like China will exceed its target GDP growth rate of 8% in 2009 and then hit double digit growth in 2010 before reaching a steady state rate of about 9% annual growth. The outlook for the Indian economy continues to improve. GDP growth is forecast to accelerate from just less than 6% this year to 7% next year and then climb to almost 8% during the following years. Economies in other Asian countries such as Indonesia also are expected to grow at higher rates due largely to stronger growth in China and India.
The basic materials story has not changed. Strong and steady growth, particularly in the large developing countries of Asia, is projected to stress the world’s capacity to supply the resources needed to feed, cloth, house and power a growing and more affluent population. The recovery during the next few years is expected to re-stoke food and fuel demand, boost grain and oilseed growth rates, keep agricultural and other commodity prices at relatively high levels, and drive strong crop nutrient demand growth. Food security and food price stability likely will move back up the policy agenda now that the global economy is growing again and following poor harvests in some of these countries this year.
Strong Ag Fundamentals
Another key driver of the recovery in P&K demand is the positive outlook for production agriculture. Back-to-back bumper crops have re-built global grain and oilseed stocks and calmed agricultural commodity markets. Our analysis, however, indicates that global stocks still are not at secure levels.
The record crop harvested in 2008 resulted in a 78 million tonne build of global grain and oilseed inventories during the 2008/09 crop year. The near-record crop this year is expected to increase stocks another 15 million tonnes in 2009/10. However, the estimated stock build during these two years will add only 11 days of use to global inventories or increase stocks from 62 days of use at the end of 2007/08 to 73 days of use at the end of the 2009/10 crop year.
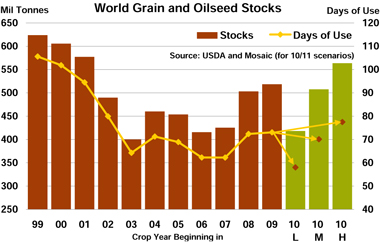
This analysis shows how different production and use scenarios will impact grain and oilseed stocks by the end of the 2010/11 crop year. The low scenario results in stocks dropping to less than 420 million tonnes or just 58 days of projected use. The only time inventories have declined to less than 60 days of use was in the early 1970s. The medium scenario keeps inventories in the 500 million tonne range, but expected demand growth still reduces inventories to 70 days of use. The high scenario – or a three-peat monster harvest – causes stocks to increase to more than 560 million tonnes or about 77 days of use, the highest level since the beginning of this decade.
We often are asked what constitutes a secure level of global grain and oilseed inventories. We use this analysis to answer that question: our definition of a secure level is one that can absorb a

supply shock without causing a disruptive spike in agricultural commodity prices. Based on this definition and scenario analysis, we conclude that global grain and oilseed stocks still are not at a secure level.
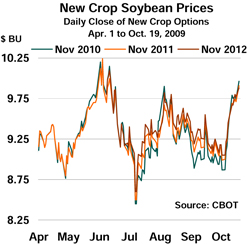
Futures markets agree with that assessment. For example, corn and soybean prices for the 2010, 2011 and 2012 crops were trading north of $4.25 per bushel and $9.90 per bushel, respectively, when this issue went to press. Markets are asking farmers to keep their foot on the accelerator.
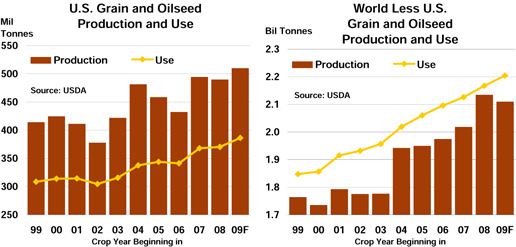
A Tale of Two Regions
Although global grain and oilseed production is projected to decline only slightly from the record crop last year, this year’s harvest is a tale of two regions. In the United States, farmers are expected to harvest a record crop of 510 million tonnes, up more than 20 million tonnes from a year ago. U.S. farmers planted fewer acres this year, but have or are expected to harvest record yields for spring wheat and corn as well as near-record yields for soybeans and several other crops. A wet spring delayed planting, but conditions turned ideal for the late-maturing crop with timely rains in August and record Growing Degree Days in September. However, most analysts expect that the hard frost and wet weather throughout much of the Corn Belt and Northern Plains during the first half of October damaged the late maturing crops and will increase harvest losses. This year’s harvest is likely to prove an exception to the rule that big crops always get bigger.
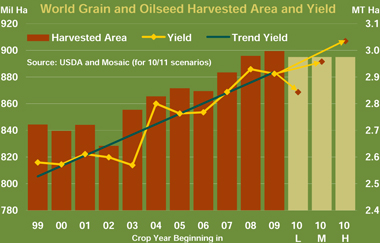
Growing conditions were not as favorable in other parts of the world. In fact, grain and oilseed production in the rest of the world is expected to decline about 25 million tonnes this year, the first decline in seven years. Although harvested area outside the United States climbed to a record high this year, average yields declined due to drought, disease and lower input use.
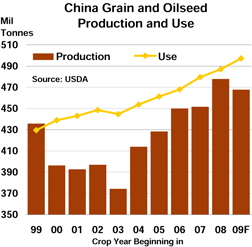
China: Focus On Food Security
China’s grain and oilseed harvest will decline this year for the first time since 2003. Some private forecasters estimate that the corn crop could drop more than 10% this year. China still will harvest the second largest crop ever this year, but the small hiccup in production will open a significant gap between use and production in 2009/10. China is expected to fill this gap with record oilseed imports, a large drawdown of its coarse grain inventories and even imports of feed ingredients such as Dried Distillers Grains. Given the projected pick-up in GDP growth and the smaller harvest this
2010/11 Scenario Assumptions
All three scenarios assume that harvested area will decrease 0.5% to 895 million hectares in 2010 due to lower crop prices this year. That still would nearly match the second largest area ever harvested. Harvested area has increased 7% or about 60 million hectares during this decade or roughly twice the current harvested area in Argentina.
Each scenario assumes a different average yield. The medium scenario assumes the trend yield of 2.96 tonnes per hectare in 2010. The low scenario yield of 2.84 tonnes per hectare is the 2010 trend yield less the largest negative deviation from trend during the last 11 years. The high scenario assumes the 2010 trend yield plus the largest positive deviation from trend during the last 11 years or a record of 3.03 tonnes per hectare.
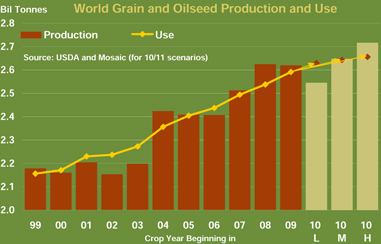
The three production scenarios for 2010 assume the harvested area and average yield combinations described above. The demand estimates assume growth of 1.5%, 2.0% and 2.5% in the low, medium and high scenarios, respectively. Despite the deepest global economic downturn since the Great Depression, global grain and oilseed use continued its steady march upward in 2008/09. World use increased 1.8% or 44 million tonnes in 2008/09 and is projected to increase another 2.1% or 53 million tonnes in 2009/10, according to the most recent USDA estimates.

year, planners are expected to direct resources into the agriculture sector in order to boost productivity. Investments in rural infrastructure, irrigation systems and improved seed technologies are critical to achieving key policy objectives of food security and stable food prices.
Such a policy thrust has important implications for crop nutrient suppliers. First, planners are expected to keep farm economics profitable in order to stimulate domestic grain and oilseed production – and overall crop nutrient use.
Second, we expect a renewed effort to achieve more balanced nutrient use, especially programs to get potash use back on track. For example, net MOP imports have plummeted during the last two years from a record 9.1 million tonnes in 2007 to 5.0 million tonnes in 2008. Net imports are expected to drop to less than 2.5 million tonnes KCL in 2009. Despite increases in domestic production, the sharp drop in imports coupled with reports of significant channel inventories implies a collapse of Chinese potash use and a loss of the important gains made earlier this decade. Implied potash use – or production plus imports minus exports – in 2009 is projected to drop to about half of the 2007 peak. We expect a strong rebound in MOP imports in 2010 due to positive farm economics and a renewed effort to stimulate agricultural productivity. At this point, we forecast that MOP imports will increase to 4.0 to 5.0 million tonnes KCL in 2010.
![]()
Finally, Chinese officials appear committed to maintaining a large strategic reserve of crop nutrients. A large strategic reserve coupled with prospects for strong nutrient demand growth and structural changes in the domestic phosphate industry suggests that Chinese DAP/MAP exports likely will remain at moderate levels in 2010. We project that Chinese DAP/MAP exports will total 2.5 to 3.0 million tonnes in 2010.
India: Monsoon Scare
Grain and oilseed production is expected to decline this year as a result of the worst drought since 1972. The decline follows two bumper crops that enabled India to build adequate reserves to meet a potential shortfall this year. Nevertheless, the supply shock this year demonstrates the delicate balance between production and use in a large and rapidly developing country like India.
A late revival of the monsoon has averted a disaster, but rainfall this year is expected register a 23% decline from the 50-year average. The poor monsoon reduced planted area during the Kharif season (from April to September) by about 6.5 million hectares and has resulted in sub-par cotton, peanut, rice and sugar yields. Rice production is projected to drop to a five year low and world sugar prices have increased sharply in response to the prospect of a smaller Indian crop.
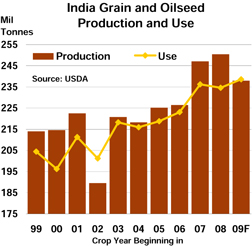
The drop in production during the Kharif season has heightened efforts to maximize planted area and yields during the Rabi season (October to March). The combination of high domestic grain and oilseed prices and low maximum retail prices (MRPs) for crop nutrients produces very attractive farm returns and fuels strong nutrient demand. For example, DAP/MAP use is projected to increase to a record 10.3 million tonnes in 2009/10 and imports are estimated to total 6.5 million tonnes in 2009. We forecast that India will import 6.5 to 7.0 million tonnes of DAP/MAP in 2010. MOP imports also are forecast to rebound to 5.5 to 6.0 million tonnes KCL in 2010, up from an estimated 4.3 million tonnes KCL in 2009 and potentially in line with the record of 6.0 million tonnes in 2008.
The Indian government pays a subsidy to domestic producers and importers equal to the difference between international crop nutrient prices and the MRP. The MRPs for DAP and MOP are 9350 rupees and 4455 rupees, respectively, or about $200 per tonne for DAP and $95 per tonne for MOP at current exchange rates. Record crop nutrient prices last year caused an explosion in the subsidy cost and have focused political efforts on reform. The most popular version of reform is a transition to a nutrient based, fixed subsidy paid directly to Indian farmers. The change has great appeal in theory but implementation poses significant challenges. Subsidy reform of some sort is likely and any reform that significantly increases retail prices to Indian farmers threatens both nutrient demand growth as well as agricultural productivity growth.
Brazil: Planting a Record Soybean Crop
The 2009 harvest was down about 7% or 10 million tonnes from the record crop in 2008. This year’s crop still ranked as the second largest ever, however. Corn production dropped 13% or almost 8.0 million tonnes due to a decline in harvested area and a 9% decline in the average yield. Soybean output declined 7% or 4.0 million tonnes due to an 8% drop in the average yield. The drop in soybean production this year was the largest one-year decline since 1991.
Prospects for the 2009/10 crop are much improved. Soil moisture has increased to normal levels in most regions and analysts expect a record soybean harvest of 62 to 65 million tonnes in 2010. Farmers are expected to plant more soybeans and less corn this year due to relatively
high soybean prices and lower input costs. Markets will pay close attention to growing conditions here as well as in other important Southern Hemisphere countries during the next several months.
Total fertilizer use is projected to decline to about 21 million tonnes in 2009 due to the switch from corn to soybeans as well as expected reductions in application rates. Fertilizer use peaked at 24.6 million tonnes in 2007 and dropped to 22.4 million tonnes in 2008. Import demand has followed the same pattern. Processed phosphate import demand peaked at almost 3.7 million tonnes in 2007 and then declined to 2.7 million tonnes in 2008. We estimate import demand will decline to 2.1 million tonnes in 2009. Processed phosphate imports are forecast to increase 15% to 25% to 2.4 to 2.6 million tonnes in 2010. The moderate recovery in imports is driven by forecasts for a 4% to 5% increase in domestic use, steady domestic production and a further de-stocking of distribution pipeline inventories.
MOP import demand is projected to rebound to 5.7 to 6.2 million tonnes KCL in 2010, up from an estimated 3.5 million tonnes in 2009 but still less than peak levels of 6.7 million tonnes in 2007 and 6.5 million tonnes in 2008. The recovery in imports is driven by a nearly 20% expected rebound in domestic use, steady local production and a sharp drawdown of distribution pipeline stocks this year. Potash usage is expected to increase on all major crops including soybeans, corn and sugar cane. After increasing about one million tonnes in 2008, we estimate that channel inventories will drop by a comparable or greater amount in 2009.
Argentina: More than a Weather Problem
The 2009 harvest was hurt by a severe drought in some regions as well as by cutbacks in crop input use. The Argentine harvest was the smallest in 10 years and yields for key crops such as soybeans and wheat were the lowest since the mid-1990s.
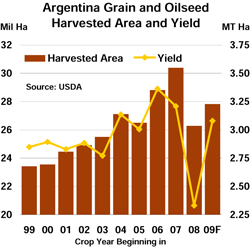
Drought was the major cause of the decline in production, but our analysis indicates that the reduction in crop input use also played a role. A statistical analysis of yields, crop nutrient application rates and rainfall for the last 18 years indicated that the sharp decline in application rates accounted for more than one-quarter of the decline in the average yield this year. The decline in rainfall accounted for the rest.
Prospects for the 2010 crop are much improved from a year ago. The drought has broken and soil moisture has increased to normal levels in most regions. Farm economics for most crops are attractive due to the expectation of a recovery in yields, relatively high new crop prices and lower input costs. As a result, we forecast that DAP/MAP/TSP imports will rebound to 800,000 to 900,000 tonnes in 2010, up more than 50 percent from 2009 but still less than the peak of nearly 1.4 million tonnes in 2007.
North America: Buyers Remain Cautious
Distributors remain cautious about the fall application season due to the late harvest, concerns about the level of agricultural commodity prices, uncertainties about crop nutrient prices, and more conservative procurement practices. Many are waiting to get a better read on post harvest demand before restocking warehouses. As a consequence, we expect a strong but not necessarily full recovery in North American demand this year. Absent a catalyst such as a sharp run-up in agricultural commodity prices, it likely will take another year before demand – particularly for potash – returns to normal levels.
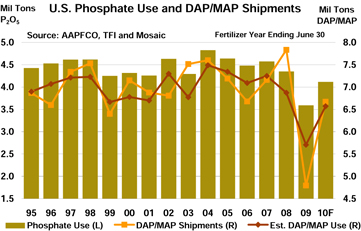
Based on initial acreage and application rate scenarios, U.S. phosphate use is projected to rebound 10% to 20% in 2009/10 to 3.9 to 4.3 million tons P2O5. We estimate that phosphate use declined 15% to 20% last year to 3.5 to 3.7 million tons, the lowest level of phosphate use during the modern era of production agriculture (or since 1970). U.S. phosphate use peaked in 1976/77 at 5.6 million tons and the five-year average is 4.6 million tons.
Implied shipments of DAP/MAP into U.S. distribution channels declined even more than use last year, plunging 39% or 3.0 million tons from a record high of 7.8 million tons in 2007/08 to a record low of just 4.8 million tons in 2008/09. We estimate that DAP/MAP inventories in the U.S. distribution pipeline likely declined 800,000 to 1.0 million tons last year. Assuming a 10% to 20% rebound in U.S. phosphate use and a small restocking of the pipeline, we project that shipments of DAP/MAP into U.S. distribution channels will rebound 35% to 45% or to 6.5 to 7.0 million tons in 2009/10. The five-year average is 7.3 million tons. Shipments are off to a good start so far this fertilizer year with first quarter (Jul-Sep) deliveries up about 24% from a year ago.
We project that U.S. potash use will rebound 20% to 35% or to 3.5 to 4.0 million tons K2O in 2009/10. That would still rank as the second lowest use in modern history. We estimate that potash use plunged 35% to 40% last year to 2.9 to 3.1 million tons K2O, the lowest level in modern history. U.S. potash use peaked at 6.3 million tons in 1980/81. The five-year average is 5.1 million tons.
Implied shipments of MOP into the North American distribution pipeline for both agricultural and industrial uses plummeted 50% or 5.3 million tons to only 5.4 million tons KCL in 2008/09. We estimate that North American distribution pipeline inventories declined 1.4 to 1.6 million tons KCL in 2008/09. Based on an expected 20% to 35% rebound in U.S. potash use, we project that MOP shipments into North American distribution channels will rebound 50% to 65% this year or to 8.0 to 8.8 million tons. The five-year average is 10.8 million tons. MOP shipments, however, are off to a slow start. Shipments

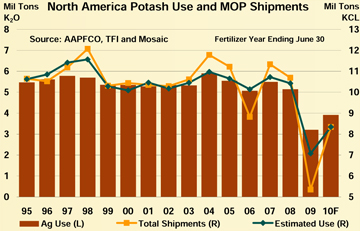
for the first quarter of the fertilizer year (Jul-Sep) totaled less than 1.0 million tons, down about 54% or 1.1 million tons from a year ago.
World P&K Import Demand
World import demand for the major phosphate and potash products is forecast to rebound sharply in 2010 based on the projected increases in key importing countries. Phosphate shipments have picked up already and developments during the past few months suggest to us that potash demand is on the brink of recovery.
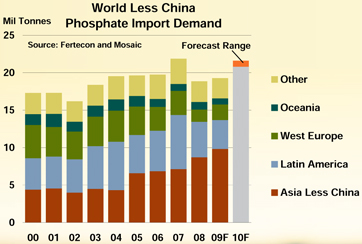
In the case of phosphate, we project that import demand for the three main products (DAP/MAP/TSP) will increase 8% to 12% or from 19.3 million tonnes in 2009 to 20.8 to 21.6 million tonnes in 2010. Demand is Asia is expected to remain steady at high levels. Latin America is projected to account for about one-half of the projected increase and other regions such as Oceania and Europe also are forecast to register gains next year. The 2010 forecast is less than the 2007 peak of 21.9 million tonnes, but it would rank as the second highest level ever.
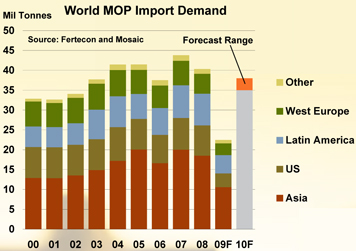
In the case of potash, we forecast that MOP demand will rebound sharply in 2010 from the extremely low levels this year. In particular, world import demand is projected to jump 55% to 70% or from less than 23 million tonnes KCL in 2009 to 35 to 38 million tonnes in 2010. We expect strong recoveries in all of the major potash importing countries next year. That may look like an optimistic forecast, but import demand is expected to plunge 44% or almost 18 million tonnes in 2009. The large projected rebound next year makes up much of but not all of the decline this year and this forecast still falls short of the peak of about 44 million tonnes in 2007.
|
|
The Mosaic Company Atria Corporate Center, Suite E490 3033 Campus Drive Plymouth, MN 55441
(800) 918-8270 toll free (763) 577-2700 |

This publication contains forward-looking statements within the meaning of the Private Securities Litigation Reform Act of 1995. Such statements include, but are not limited to, statements about future financial and operating results. Such statements are based upon the current beliefs and expectations of The Mosaic Company’s management and are subject to significant risks and uncertainties.
These risks and uncertainties include but are not limited to the predictability and volatility of, and customer expectations about, agriculture, fertilizer, raw material, energy and transportation markets that are subject to competitive and other pressures and the effects of the current economic and financial turmoil; the build-up of inventories in the distribution channels for crop nutrients; changes in foreign currency and exchange rates; international trade risks; changes in government policy; changes in environmental and other governmental regulation, including greenhouse gas regulation; difficulties or delays in receiving, or increased costs of, necessary governmental permits or approvals; the effectiveness of our processes for managing our strategic priorities; adverse weather conditions affecting operations in Central Florida or the Gulf Coast of the United States, including potential hurricanes or excess rainfall; actual costs of asset retirement, environmental remediation, reclamation or other environmental regulation differing from management’s current estimates; accidents and other disruptions involving Mosaic’s operations, including brine inflows at its Esterhazy, Saskatchewan potash mine and other potential mine fires, floods, explosions, seismic events or releases of hazardous or volatile chemicals, as well as other risks and uncertainties reported from time to time in The Mosaic Company’s reports filed with the Securities and Exchange Commission. Actual results may differ from those set forth in the forward-looking statements.
Copyright © 2009. The Mosaic Company. All rights reserved.