Attached files
| file | filename |
|---|---|
| 8-K - FORM 8-K - Western Union CO | d8k.htm |
| EX-99.1 - PRESS RELEASE - Western Union CO | dex991.htm |
 Third Quarter 2009 Earnings Webcast & Conference Call October 20, 2009 Exhibit 99.2 |
 Mike
Salop Senior Vice President Investor Relations |
 3 Safe Harbor This presentation contains certain statements that are forward-looking within the meaning of the
Private Securities Litigation Reform Act of 1995. These statements are not guarantees of future
performance and involve certain risks, uncertainties and assumptions that are difficult to predict. Actual outcomes and results may differ materially from those expressed in, or implied by, our
forward-looking statements. Words such as “expects,” “intends,”
“anticipates,” “believes,” “estimates,” “guides,” “provides guidance,” “provides outlook” and other similar expressions or future or conditional verbs such as “will,” “should,” “would” and “could”
are intended to identify such forward-looking statements. Readers of this presentation by
The Western Union Company (the “Company,” “Western Union,” “we,” “our” or “us”) should not rely solely on the forward-looking statements and should consider all uncertainties and risks discussed in the Risk Factors section and
throughout the Annual Report on Form 10-K for the year ended December 31, 2008. The
statements are only as of the date they are made, and the Company undertakes no obligation to update any forward-looking statement. Possible events or factors that could cause results or performance to differ materially from those
expressed in our forward-looking statements include the following: changes in general
economic conditions and economic conditions in the regions and industries in which we operate; adverse movements and volatility in capital markets and other events which affect our liquidity, the liquidity of
our agents or clients, or the value of, or our ability to recover our investments; changes in
immigration laws, patterns and other factors related to migrants; technological changes, particularly with respect to e-commerce; the failure by us, our agents or subagents to comply with our business and
technology standards and contract requirements or applicable laws and regulations, especially
laws designed to prevent money laundering and terrorist financing, and/or changing regulatory
or enforcement interpretations of those laws; failure to resolve pending legal issues with the State of Arizona in a satisfactory manner; our ability to attract and retain qualified key employees and to manage our workforce successfully; changes
in, and failure to manage effectively exposure to, foreign exchange rates, including the impact
of the regulation of foreign exchange spreads on money transfers; political conditions and
related actions in the United States and abroad which may adversely affect our businesses and economic conditions as a whole; failure to maintain sufficient amounts or types of regulatory capital to meet the changing requirements of our
regulators worldwide; significantly slower growth or declines in the money transfer market and
other markets in which we operate; failure to implement agent contracts according to schedule;
our ability to maintain our agent network and biller relationships under terms consistent with or more advantageous to us than those currently in place; interruptions of United States government relations with countries in which we have or
are implementing material agent contracts; deterioration in consumers’ and clients’
confidence in our business, or in money transfer providers generally; failure to manage credit and fraud risks presented by our agents, clients and consumers, or non-performance by our banks,
lenders, other financial services providers or insurers; adverse rating actions by credit
rating agencies; liabilities and unanticipated developments resulting from litigation and regulatory investigations and similar matters, including costs, expenses, settlements and judgments; changes in United
States or foreign laws, rules and regulations including the Internal Revenue Code, and
governmental or judicial interpretations thereof; our ability to favorably resolve tax matters with the Internal Revenue Service and other tax authorities; changes in industry standards affecting our
business; changes in accounting standards, rules and interpretations; failure to compete
effectively in the money transfer industry with respect to global and niche or corridor money transfer providers, banks and other money transfer services providers, including telecommunications
providers, card associations and card-based payment providers; our failure to develop and
introduce new products, services and enhancements, and gain market acceptance of such products; our ability to protect our brands and our other intellectual property rights; our failure to manage the
potential both for patent protection and patent liability in the context of a rapidly
developing legal framework for intellectual property protection; any material breach of security of or interruptions in any of our systems; mergers, acquisitions and integration of acquired businesses and technologies into
our company and the realization of anticipated synergies from these acquisitions; adverse
consequences from our spin-off from First Data Corporation, including resolution of certain ongoing matters; decisions to downsize, sell or close units, or to transition operating activities from one
location to another or to third parties, particularly transitions from the United States to
other countries; decisions to change our business mix; cessation of various services provided to us by third-party vendors; catastrophic events; and management’s ability to identify and manage
these and other risks. |
 Christina Gold President & Chief Executive Officer |
 5 Financial Highlights – Q3 2009 Note: See appendix for reconciliation of Non-GAAP to GAAP measures. Consolidated Revenue $1.3B GAAP EPS $0.26 EPS, excluding settlement accrual $0.33 C2C Revenue - YoY Change (5)% C2C Revenue - YoY Change, constant currency (3)% C2C Transactions - YoY Change 3% Geographic diversity |
 6 Geographically Diverse Portfolio Revenue Transactions Q3 09 (3)% 8% Europe, Middle East, Africa, S. Asia 46% of Western Union revenue Western Europe consistent with Q2 2009 Spain and Russia remain challenged Gulf States strong transaction growth but moderated from Q2 2009
|
 7 Geographically Diverse Portfolio Revenue Transactions Q3 09 Americas (10)% (4)% 31% of Western Union revenue Americas trends improved slightly from Q2 2009 Mexico continues to be challenged U.S outbound consistent with recent quarters Repositioning U.S. domestic money transfer |
 8 Geographically Diverse Portfolio Revenue Transactions Q3 09 Asia Pacific 5% 15% 8% of Western Union revenue China 7% transaction and revenue growth Renewal of Agricultural Bank of China adding 15,000 locations by 2011 Asia Pacific region represents significant growth opportunity Philippines transaction growth slowed from Q2 2009 |
 9 Intra-country Leverage network and high brand awareness Westernunion.com 14 send countries Profitable, high growth Account-to-cash New customers C2C Channel Initiatives |
 10
Revenue Transactions Q3 09 Global Business Payments (3)% 2% 13% of Western Union revenue Custom House closed September 1 Comparable trends to Q2 2009, excluding Custom House Global Business Payments st |
 Scott Scheirman Executive Vice President & Chief Financial Officer |
 12
Financial Results – Q3 2009 Note: See appendix for reconciliation of Non-GAAP to GAAP measures. Revenue $1.3B Revenue - YoY Change (5)% Revenue - YoY Change, constant currency (2)% GAAP EPS $0.26 EPS, excluding settlement accrual $0.33 $71 million pre-tax accrual for anticipated regulatory settlement
|
 13
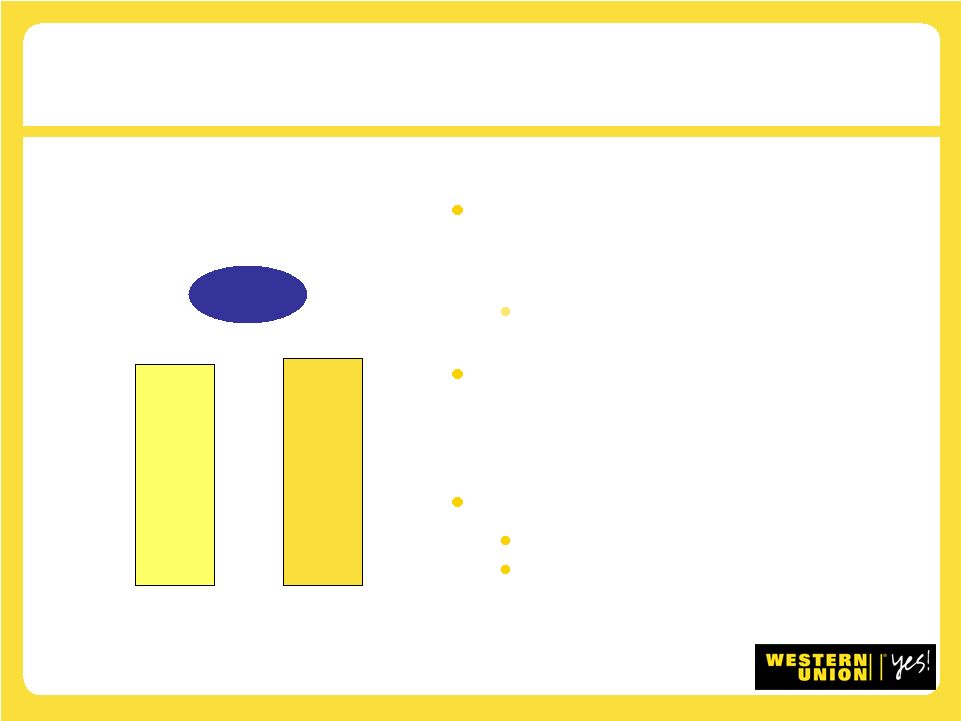
Transaction Fee Components of Revenue Foreign Exchange $1,099 $1,040 (5)% $239 $238 flat ($ in millions) Q3 2008 Q3 2009 Q3 2008 Q3 2009 |
 Remittance Trends World Bank Report forecasts remittances to developing countries down 7% to 10% in 2009* Expects modest growth in 2010 Total YTD Western Union cross- border principal of $48 billion, down 5% (flat constant currency) Principal and revenue per transaction Comparable to 1H09 YoY PPT down 7% (down 4% constant currency) 14 * Migration and Development Brief 10 (July 2009) on remittance cross-border flows to
developing countries 49 50 Q3 2008 Q3 2009 Up 3% C2C Transactions (millions) Note: See appendix for reconciliation of Non-GAAP to GAAP measures. |
 15 Cost of Services – As a Percent of Revenue Strong gross margins FEXCO acquisition Cost reductions Selective agent commission reductions Overall expense management Q3 2008 Q3 2009 57.0% 56.5%
|
 16
SG&A – As a Percent of Revenue Settlement accrual five percentage points impact SG&A consistent with Q2 2009, excluding settlement accrual 4.5% marketing spend 15.7% 22.1% Q3 2008 Q3 2009 |
 17
Operating Margin Note: See appendix for reconciliation of Non-GAAP to GAAP measures. Consistent operating margin, excluding settlement accrual Variable cost structure Cost reductions 27.2% 21.4% 26.8% Q3 2008 Reported Q3 2009 Reported Q3 2009 Ex Accrual |
 18
Tax Rate Higher foreign-derived profits Tax efficient strategies 27.7% 26.6% Q3 2008 Q3 2009 |
 19
Consumer-to-Consumer Q3 2009 Change (millions) Transactions 50 3% Revenue $1,118 (5)% Revenue, constant currency (3)% Note: See appendix for reconciliation of Non-GAAP to GAAP measures. Operating Income (6)% Operating Margin (20) bps 27.6% $309 85% of revenue |
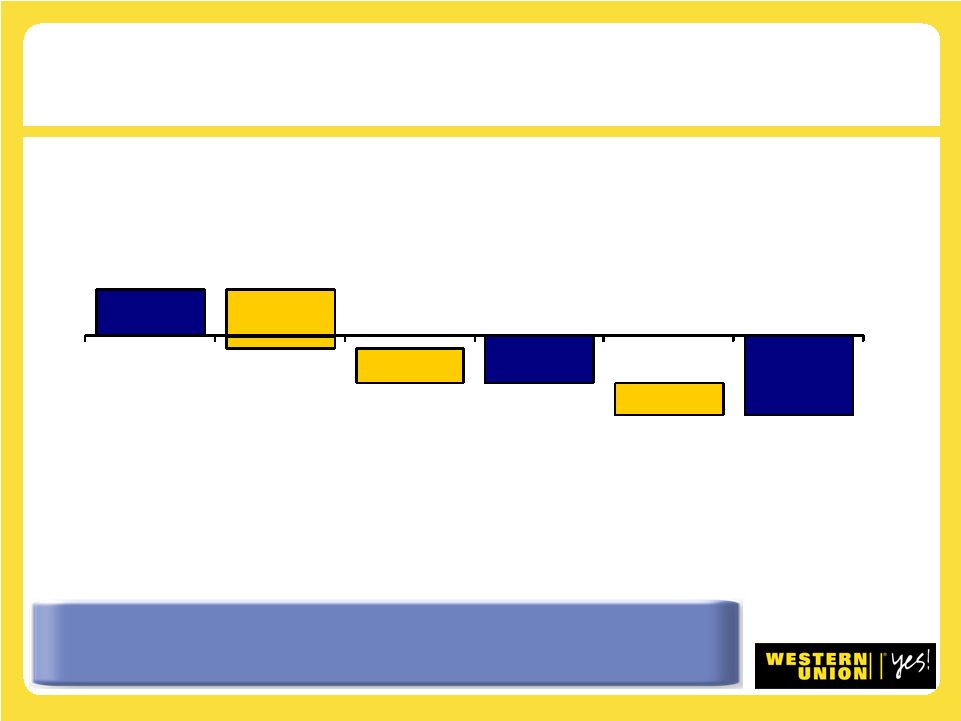 3% -3% -5% Transaction Growth Mix Price Reductions Constant Currency Revenue Decline Currency Impact Reported Revenue Decline + 20 C2C Transaction and Revenue Growth Note: See appendix for reconciliation of Non-GAAP to GAAP measures. Q3 2009 Mix and price reductions consistent with recent quarters |
 21 Global Business Payments Q3 2009 Change (millions) Transactions 105 2% Revenue $171 (3)% Operating Income $42 (11)% Operating Margin 24.3% (210) bps Revenue, excluding Custom House Note: See appendix for reconciliation of Non-GAAP to GAAP measures. $163 Operating Margin, excluding Custom House 26.3% (10) bps (7)% 13% of revenue |
 22
Liquidity is a Distinct Advantage Cash Flows From Operations, YTD $958 million Cash Balance, September 30, 2009 $1.6 billion Debt Outstanding, September 30, 2009 $3.0 billion Capital Expenditures, YTD $67 million $1 billion due in 2011 $500 million due in 2014 $1 billion due in 2016 $500 million due in 2036 |
 23
2009 Outlook Note: See appendix for reconciliation of Non-GAAP to GAAP measures. Constant currency revenue down 1% to 2% GAAP revenue down 4% to 5% GAAP operating income margin of approx. 25% Approx. 27% excluding the settlement accrual GAAP EPS of $1.15 to $1.20 $1.23 to $1.28 excluding $0.08 from the settlement accrual Constant currency EPS $0.01 lower Cash flow from operations to exceed $1.1 billion Outlook now includes Custom House Adds less than 1% to revenue growth $0.01 EPS dilution |
 Christina Gold President & Chief Executive Officer |
 Extending leadership position 25 Focused Strategy Priority growth initiatives gaining momentum Balancing profitability and investment Significant global opportunities New customers and product offerings |
 26 Building on Success – Attract New, Incremental Customers Banking Strategy Expand distribution, reach new customers Payment Services Directive Grow retail class of trade in Europe Custom House Investing to grow global business-to-business payments Prepaid MoneyWise Visa card Western Union Visa Gold Card ™ ® ® |
 Mobile Active pilots Expanding mobile enabled send locations Developing mobile send capability 27 Building on Success – Attract New, Incremental Customers |
 28
Positioned for Growth World-class brand 400,000 agent locations Strong financial position Expanding into broader payments markets Multiple channel strategy Geographically diverse revenue stream Scalable infrastructure Industry-leading compliance capabilities Global leader |
 Third Quarter 2009 Earnings Webcast & Conference Call October 20, 2009 Appendix |
 30
Non-GAAP Measures Western Union's management has presented: (1) Consolidated,
consumer-to-consumer segment, international consumer-to-consumer, and international consumer-to-consumer excluding United States
originated transactions revenue declines, excluding the impact of translating foreign currency denominated revenues into United States dollars; (2)
Operating income margin, excluding the impact from the estimated settlement accrual; (3) Earnings per share excluding the impact from the
estimated settlement accrual; (4) Consumer-to-consumer cross- border principal decline and consumer-to-consumer principal per
transaction decline, excluding the impact of translating foreign currency denominated amounts into United States dollars; (5) Global Business Payments
revenue decline and operating income margin, excluding the
impact from the Custom House acquisition; (6) 2009 Revenue outlook, excluding the estimated impact of translating foreign currency denominated revenue into United States dollars; and (7) 2009 earnings per
share and operating income margin outlook, excluding the impact
from the estimated settlement accrual. Western Union's management believes these non-GAAP measures provide meaningful supplemental information regarding our operating results to assist
management, investors, analysts, and others in understanding our financial results and to better analyze trends in our underlying business,
because they provide consistency and comparability to prior periods. A non-GAAP financial measure should not be considered in isolation or as
a substitute for the most comparable GAAP financial measure. A
non-GAAP financial measure reflects an additional way of viewing aspects of our operations that, when viewed with our GAAP results and the reconciliation to the corresponding GAAP financial measure, provide
a more complete understanding of our business. Users of the
financial statements are encouraged to review our financial statements and publicly-filed reports in their entirety and not to rely on any single financial measure. A reconciliation of non-GAAP measures to
the most directly comparable GAAP financial measures is included
on the following pages. |
 31 THE WESTERN UNION COMPANY RECONCILIATION OF NON-GAAP MEASURES (in millions) (unaudited) Consolidated Consumer-to- Consumer Segment International Consumer-to- Consumer International Consumer-to- Consumer excluding United States originated transactions 2009 Revenues, as reported (GAAP) $
1,314.1 $
1,117.8 $
926.5 $
765.5 Reversal of
impact from translation of foreign currency denominated amounts
into United States dollars (a) 31.1 24.4 22.6 22.6 $
1,345.2 $
1,142.2 $
949.1 $
788.1 2008
Revenues, as reported (GAAP) $
1,377.4 $
1,178.1 $
950.6 $
782.2 Revenue
decline, as reported (GAAP) (5)% (5)% (3)% (2)% Revenue (decline)/growth, adjusted (2)% (3)% 0% 1% Refer to footnote explanations at the end of this "Reconciliation of
Non-GAAP Measures." Adjustments: 2009 Revenues, adjusted Three Months Ended September 30, 2009 |
 32
THE WESTERN UNION COMPANY RECONCILIATION OF NON-GAAP MEASURES (in millions) (unaudited) Revenues $
1,314.1 $
3,769.6 $
281.5 $
964.1 Settlement accrual (b) 71.0 $
352.5 $
1,035.1 Operating income margin, as reported (GAAP) 21.4% 25.6% Operating income margin, adjusted 26.8% 27.5% Operating income, as reported (GAAP) Operating income, adjusted Refer to footnote explanations at the end of this "Reconciliation of
Non-GAAP Measures." Nine Months
Ended September 30, 2009 Adjustment: Three Months Ended September 30, 2009 71.0 |
 33
THE WESTERN UNION COMPANY RECONCILIATION OF NON-GAAP MEASURES (in millions, except per share amounts) (unaudited) Three Months
Ended September 30, 2009 $
181.0 Reversal of impact from the settlement accrual, net of income tax benefit
of $17.1 million (b) Net income, adjusted $
234.9 As reported (GAAP) $
0.26 Impact from the settlement accrual (b) EPS, adjusted $
0.33 Diluted weighted-average shares outstanding 701.6 _______ Adjustments: Earnings per share ("EPS"): Refer to footnote explanations at the end of this "Reconciliation of
Non-GAAP Measures." Net income, as reported (GAAP)
53.9 0.07 |
 34 THE WESTERN UNION COMPANY RECONCILIATION OF NON-GAAP MEASURES (in millions) (unaudited) 2009 2008 2009 2008 $ 16,990 $ 17,796 $ 47,899 $ 50,488 Reversal of impact from translation of foreign currency denominated
amounts into United States dollars (a) 542 - 2,680 - $ 17,532 $ 17,796 $ 50,579 $ 50,488 Consumer-to-consumer cross-border principal decline, as
reported (5)% (5)% Consumer-to-consumer cross-border principal change,
adjusted (1)% 0% Consumer-to-consumer cross-border principal Adjustment: Three Months Ended September 30, Nine Months Ended September 30, Consumer-to-consumer cross-border principal, adjusted Refer to footnote explanations at the end of this "Reconciliation of
Non-GAAP Measures." |
 35 THE WESTERN UNION COMPANY RECONCILIATION OF NON-GAAP MEASURES (unaudited) 2009 2008 $
371 $
401 Reversal of impact from translation of
foreign currency denominated amounts into United States dollars
(a) 12 - $
383 $
401 Consumer-to-consumer principal per
transaction decline, as reported (7)% Consumer-to-consumer principal per transaction decline,
adjusted (4)% Consumer-to-consumer principal per transaction, adjusted Refer to footnote explanations at the end of this "Reconciliation of
Non-GAAP Measures." Three Months Ended September 30, Consumer-to-consumer principal per transaction Adjustment: |
  36 THE WESTERN UNION COMPANY RECONCILIATION OF NON-GAAP MEASURES (in millions) (unaudited) 2009 2008 Global Business Payments revenue, as reported (GAAP) $
171.3 $
176.4 Reversal of Custom House revenue (c) (7.9) - Global Business Payments revenue, adjusted $
176.4 Global Business Payments operating income, as reported (GAAP) $
41.6 $
46.6 Reversal of Custom House operating loss (c) 1.3 - $
42.9 $
46.6 Global Business Payments revenue decline, as reported (GAAP) (3)% Global Business Payments revenue decline, adjusted (7)% Operating income margin, as reported (GAAP) 24.3% Operating income margin, adjusted 26.3% Three Months Ended September 30, Adjustment: Adjustment: Operating income, adjusted Refer to footnote explanations at the end of this "Reconciliation of
Non-GAAP Measures." $
163.4 |
 37 THE WESTERN UNION COMPANY RECONCILIATION OF NON-GAAP MEASURES (unaudited) 2009 Revenue Outlook Revenue declines GAAP basis (4)% (5)% Adjustment: Reversal of estimated impact of translation of foreign currency denominated amounts into United States dollars (d) 3% 3% Adjusted estimated revenue declines (1)% (2)% 2009 Operating Income Margin Outlook Operating income margin GAAP basis 25% Adjustment: Reversal of impact from the settlement accrual (b) 2% Adjusted estimated operating income margin 27% 2009 EPS Outlook $
1.15 $
1.20 Adjustment: Reversal of impact from the settlement accrual (b) 0.08 0.08 $
1.23 $
1.28 Refer to footnote explanations at the end
of this "Reconciliation of Non-GAAP Measures." Range EPS guidance GAAP basis Adjusted estimated EPS guidance Range |
 38
Footnote explanations (a) (b) (c) (d) Represents the impact from the fluctuation in exchange rates between all
foreign currency denominated amounts and the United States
dollar. Constant currency results exclude any benefit or loss caused by foreign exchange fluctuations between foreign currencies and the United States dollar, net of foreign currency
hedges, which would not have occurred if there had been a
constant exchange rate. In addition, to compute constant currency earnings per share, the Company assumes the impact of fluctuations in foreign currency derivatives not designated as
hedges and the portion of fair value that is excluded from the
measure of effectiveness for those contracts designated as hedges was consistent with the prior year. Estimated accrual for an anticipated agreement to resolve the Company's
disputes with the State of Arizona and to fund a multi-state
not-for-profit organization focused on border safety and security ("settlement accrual"). This item has been included in the selling, general and administrative expense line of the
consolidated statements of income, and was not allocated to the
segments. Represents the estimated impact from the fluctuation in
exchange rates between all foreign currency denominated amounts and the United States dollar. Constant currency results exclude any
estimated benefit or loss caused by foreign exchange fluctuations between foreign currencies and the United States dollar, net of
foreign currency hedges, which would not have occurred if there
had been a constant exchange rate. In addition, to compute constant currency earnings per share, the Company assumes the estimated impact of fluctuations in foreign currency
derivatives not designated as hedges and the portion of fair
value that is excluded from the measure of effectiveness for those contracts designated as hedges is consistent with the prior year. Represents the incremental impact from the acquisition of Custom House on
Global Business Payments revenue and operating income
margin. |
 39
Use of Material The information contained in this presentation is being provided for your convenience and information only. This information is accurate as of the date of its initial presentation, October 20, 2009. If you plan to use this information for any purpose, verification of its continued accuracy is your responsibility. The Western Union Company assumes no duty to update or revise the information contained in this presentation. You may reproduce information contained in this presentation provided you do not alter, edit, or delete any of the content and provided you identify the source of the information as The Western Union Company which owns the copyright. |