Attached files
| file | filename |
|---|---|
| EX-32 - EX-32 - Watson Wyatt Worldwide, Inc. | a09-31905_1ex32.htm |
| EX-21 - EX-21 - Watson Wyatt Worldwide, Inc. | a09-31905_1ex21.htm |
| EX-31.2 - EX-31.2 - Watson Wyatt Worldwide, Inc. | a09-31905_1ex31d2.htm |
| EX-31.1 - EX-31.1 - Watson Wyatt Worldwide, Inc. | a09-31905_1ex31d1.htm |
UNITED STATES
SECURITIES AND EXCHANGE COMMISSION
Washington, D.C. 20549
FORM 10-K/A
Amendment No. 1
(Mark One)
|
x |
ANNUAL REPORT PURSUANT TO SECTION 13 OR 15 (d) OF THE SECURITIES EXCHANGE ACT OF 1934 |
|
|
|
|
For the fiscal year ended June 30, 2009 |
|
Or
|
o |
TRANSITION REPORT PURSUANT TO SECTION 13 OR 15 (d) OF THE SECURITIES EXCHANGE ACT OF 1934 |
|
|
|
|
For the transition period from to |
|
Commission File Number: 001-16159
WATSON WYATT WORLDWIDE, INC.
(Exact name of registrant as specified in its charter)
|
Delaware |
|
52-2211537 |
|
(State or other jurisdiction of |
|
(I.R.S. Employer |
901 N. Glebe Road, Arlington, VA 22203
(Address of principal executive offices) (Zip Code)
(703) 258-8000
(Registrant’s telephone number, including area code)
Securities registered pursuant to Section 12(b) of the Act:
|
Title of each class |
|
Name of each exchange on which registered |
|
Class A Common Stock, $0.01 par value |
|
New York Stock Exchange and NASDAQ |
Securities registered pursuant to Section 12(g) of the Act:
|
|
|
|
|
(Title of class) |
||
Indicate by check mark if the registrant is a well-known seasoned issuer, as defined in Rule 405 of the Securities Act. Yes x No o
Indicate by check mark if the registrant is not required to file reports pursuant to Section 13 or Section 15(d) of the Act. Yes o No x
Indicate by check mark whether the registrant (1) has filed all reports required to be filed by Section 13 or 15(d) of the Securities Exchange Act of 1934 during the preceding 12 months (or for such shorter period that the registrant was required to file such reports), and (2) has been subject to such filing requirements for the past 90 days. Yes x No o
Indicate by check mark whether the registrant has submitted electronically and posted on its corporate Website, if any, every Interactive Data File required to be submitted and posted pursuant to Rule 405 of Regulation S-T during the preceding 12 months (or for such shorter period that the registrant was required to submit and post such files). Yes o No o
Indicate by check mark if disclosure of delinquent filers pursuant to Item 405 of Regulation S-K is not contained herein, and will not be contained, to the best of registrant’s knowledge, in definitive proxy or information statements incorporated by reference in Part III of this Form 10-K or any amendment to this Form 10-K o
Indicate by check mark whether the registrant is a large accelerated filer, an accelerated filer, a non-accelerated filer, or a smaller reporting company. See the definitions of “large accelerated filer,” “accelerated filer” and “smaller reporting company” in Rule 12b-2 of the Exchange Act.
|
Large accelerated filer x |
|
Accelerated Filer o |
|
Non-accelerated Filer o |
|
Smaller reporting company o |
|
(Do not check if a smaller reporting company) |
|
|
Indicate by check mark whether the registrant is a shell company (as defined in Rule 12b-2 of the Act). Yes o No x
The aggregate market value of the registrant’s voting and non-voting common stock held by non-affiliates of the registrant was approximately $2,032,629,030 based on the closing price as of the last business day of the registrant’s most recently completed second fiscal quarter, December 31, 2008.
As of October 15, 2009 there were outstanding 42,528,286 shares of common stock par value $0.01 per share.
EXPLANATORY NOTE
Watson Wyatt Worldwide, Inc. is filing this Amendment No. 1 on Form 10-K/A (“Amendment”) to amend its Annual Report on Form 10-K for the year ended June 30, 2009, filed with the Securities and Exchange Commission (“SEC”) on August 14, 2009 (“Original 10-K”). We are filing this Amendment to the Original 10-K to include the information required by Item 5 of Part II for the performance graph and Items 10 through 14 of Part III of Form 10-K. Except for the addition of the Part II and Part III information, no other changes have been made to the Original 10-K. This Amendment does not reflect events occurring after the filing of the Original 10-K or modify or update those disclosures affected by subsequent events.
1
WATSON WYATT WORLDWIDE, INC.
|
|
|
|
|
|
|
|
|
3 |
||
|
|
|
|
|
|
|
|
|
|
|
|
|
4 |
||
|
|
|
|
|
9 |
||
|
|
|
|
|
Security Ownership of Certain Beneficial Owners and Management and Related Stockholder Matters |
35 |
|
|
|
|
|
|
Certain Relationships and Related Transactions, and Director Independence |
37 |
|
|
|
|
|
|
38 |
2
The graph below depicts total cumulative stockholder return on $100 invested on June 30, 2004 in (1) Watson Wyatt Worldwide, Inc. common stock; (2) the New York Stock Exchange Composite Index; and (3) an independently-compiled, industry peer group index composed of the common stock of all publicly-traded companies within the Company’s standard industrial classification code (SIC) offering management consulting services. The graph assumes reinvestment of dividends.
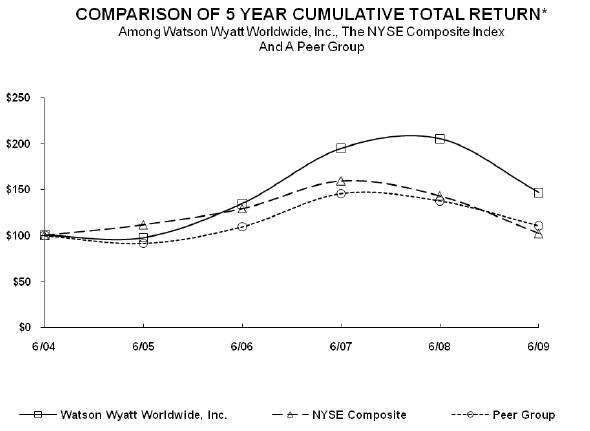
*$100 invested on 6/30/04 in stock or index, including reinvestment of dividends.
Fiscal year ending June 30.
|
|
|
6/04 |
|
6/05 |
|
6/06 |
|
6/07 |
|
6/08 |
|
6/09 |
|
|
|
|
|
|
|
|
|
|
|
|
|
|
|
|
|
Watson Wyatt Worldwide, Inc. |
|
100.00 |
|
97.27 |
|
134.70 |
|
194.76 |
|
205.27 |
|
146.61 |
|
|
NYSE Composite |
|
100.00 |
|
111.76 |
|
129.30 |
|
159.65 |
|
143.30 |
|
102.20 |
|
|
Peer Group |
|
100.00 |
|
91.40 |
|
109.58 |
|
145.66 |
|
137.62 |
|
110.62 |
|
Companies included in the independently-compiled, industry peer group index include: Accenture Limited; Access Worldwide Communications Inc.; Bearingpoint Inc.; Brandpartners Group Inc.; Corporate Executive Board Company; Diamond Management & Technology Consultants; FTI Consulting Inc.; Hewitt Associates Inc.; Huron Consulting Group Inc.; LECG Corp.; The Management Network Group Inc.; Maximus Inc.; Navigant Consulting Inc.; The Hackett Group Inc. and Watson Wyatt Worldwide, Inc. Deletions from this group include Caneum Inc.; Harris Interactive Inc.; Inventiv Health Inc. and Thomas Group Inc., because they are no longer in the Company’s SIC.
3
Item 10. Directors, Executive Officers, and Corporate Governance.
DIRECTOR INFORMATION
Listed below are the names, ages and biographies of our current directors and executive officers at September 30, 2009. Our directors are elected annually and serve until the next annual meeting of stockholders and until their successors are elected and qualified. Our executive officers serve until the next annual meeting and until the election and qualification of their successors or until their earlier death, resignation or removal by our board of directors.
John J. Gabarro (age 70) has served as a Director since 1999 and was previously a Director of Watson Wyatt & Company from 1995 to 1998. Mr. Gabarro has been a professor at the Harvard Business School since 1972. Mr. Gabarro is the UPS Foundation Professor of Human Resource Management, Emeritus, in Organizational Behavior, having also served as Baker Foundation Professor. He has taught in Harvard’s MBA, Executive and Doctoral Programs. He has served as faculty chair of Harvard’s International Senior Management Program and twice as head of its Organizational Behavior faculty and most recently, as faculty chair of Harvard’s Advanced Management Program. Mr. Gabarro completed his MBA, doctorate and post doctoral work at Harvard before joining its faculty.
John J. Haley (age 59) has served as President and Chief Executive Officer of Watson Wyatt since January 1, 1999, Chairman of the Board of Watson Wyatt since 1999 and as a director of Watson Wyatt since 1992. Mr. Haley joined Watson Wyatt in 1977. Prior to becoming President and Chief Executive Officer of Watson Wyatt, he was the Global Director of the Benefits Group at Watson Wyatt. Mr. Haley is a Fellow of the Society of Actuaries and is a co-author of Fundamentals of Private Pensions (University of Pennsylvania Press). Mr. Haley also serves on the boards of MAXIMUS, Inc., a provider of health and human services program management, consulting services and system solutions, and Hudson Highland Group, Inc., an executive search, specialty staffing and related consulting services firm. He has an A.B. in Mathematics from Rutgers College and studied under a Fellowship at the Graduate School of Mathematics at Yale University.
R. Michael McCullough (age 70) has served as a Director since 1996. Mr. McCullough retired in 1996 as Chairman and CEO of the management consulting firm Booz, Allen & Hamilton. He joined Booz, Allen & Hamilton in 1965 as a consultant, was elected a partner in the firm in 1971, became Managing Partner of the firm’s Technology Center and was elected to the position of Chairman and CEO in 1984. Mr. McCullough is a member of the board of First Potomac Realty Trust, an industrial and office-industrial real estate investment trust. Mr. McCullough has a B.S. in Electrical Engineering from the University of Detroit.
Brendan R. O’Neill (age 60) has served as a Director since July 2006. Dr. O’Neill was Chief Executive Officer and Director of Imperial Chemical Industries PLC (“ICI”), a manufacturer of specialty products and paints, until April 2003. From 2003 until 2006, Mr. O’Neill was an independent director for a range of companies. Dr. O’Neill joined ICI in 1998 as its Chief Operating Officer and Director, and was promoted to Chief Executive Officer in 1999. Prior to Dr. O’Neill’s career at ICI, he held numerous positions at Guinness PLC, including Chief Executive of Guinness Brewing Worldwide Ltd, Managing Director International Region of United Distillers, and Director of Financial Control. Dr. O’Neill also held positions at HSBC Holdings PLC, BICC PLC, Aegis Group PLC, and the Ford Motor Company. He has an M.A. from the University of Cambridge and a Ph.D. in chemistry from the University of East Anglia, and is a Fellow of the Chartered Institute of Management Accountants (U.K.). Dr. O’Neill is also a Director of Tyco International Ltd., Informa Group PLC and Endurance Specialty Holdings Ltd.
Linda D. Rabbitt (age 60) has served as a Director since 2002 and is the founder and CEO of Rand Construction Corporation, a commercial construction company founded in 1989 that specializes in building renovation and tenant build-outs. Prior to founding Rand Construction Corporation, Ms. Rabbitt was the co-founder and co-owner of Hart Construction Company, Inc., a commercial tenant construction company. From 1981 to 1985, Ms. Rabbitt was with KPMG (formerly Peat Marwick), where she was Director of Marketing from 1982 to 1985. Ms. Rabbitt is a Director of Brookfield Properties, a commercial real estate company and is a Class C Director of the Federal Reserve Bank of Richmond. Ms. Rabbitt is also a Director of the Greater Washington Board of Trade and served as its Chair in 2002. Ms. Rabbitt has also served as a Director of the Economic Club of Washington, D.C., as a Director of Leadership Washington, and is a trustee of the Federal City Council and of George Washington University. Ms. Rabbitt has a B.A. from the University of Michigan, Ann Arbor, and an M.A. from George Washington University.
4
Gilbert T. Ray (age 65) has served as a Director since 2000. Mr. Ray was a partner of the law firm of O’Melveny & Myers LLP until his retirement in 2000. He practiced corporate law for almost three decades. He has extensive experience with corporate and tax exempt transactions, as well as international finance. Mr. Ray is a member of the boards of: Automobile Club of Southern California, a provider of emergency road and travel services and insurance; two variable annuity funds managed by SunAmerica Asset management; Advance Auto Parts Company, a retailer of automotive parts; Diamondrock Hospitality, a real estate investment trust; and Dinequity, Inc., a restaurant management and franchise company. Mr. Ray is also a trustee of The John Randolph Haynes and Dora Haynes Foundation.
John C. Wright (age 61) has served as a Director since 2002 and is a retired partner of the accounting firm Ernst & Young. He was with Ernst & Young for almost thirty years until his retirement in 2000. Mr. Wright has extensive expertise with complex financial accounting and reporting matters, including many years of experience working on matters before the Securities and Exchange Commission. During the last ten years of Mr. Wright’s career at Ernst & Young, he spent much of his time on international matters. After Ernst & Young, he served briefly as the Chief Financial Officer of Teligent, a telecommunications company, and was the Executive Vice President and Chief Financial Officer of QuadraMed Corporation, a provider of healthcare information technology solutions until 2005. Mr. Wright has a B.S. in Accounting from the University of North Carolina.
BIOGRAPHICAL INFORMATION FOR OTHER EXECUTIVE OFFICERS OF THE COMPANY
Walter W. Bardenwerper (age 58) has served as Vice President and General Counsel since joining Watson Wyatt in 1987 and has served as Secretary since 1992. Mr. Bardenwerper was a Director of Watson Wyatt & Company from 1992 to 1997. He is also a Director of Professional Consultants Insurance Company. Mr. Bardenwerper was previously an attorney with Cadwalader, Wickersham & Taft and Assistant General Counsel and Secretary of Satellite Business Systems. He has a B.A. with Honors in Economics and graduated Phi Beta Kappa from the University of Virginia, has a J.D. from the University of Virginia Law School and served as a Law Clerk to United States District Court Judge Albert W. Coffrin.
Robert J. Charles (age 44) has been a Vice President and the Regional Manager (Asia-Pacific) of Watson Wyatt since 2007. Mr. Charles was previously the Regional Practice Leader for the Benefits Practice in Asia-Pacific from 2003 to 2007 and also the Managing Consultant for Watson Wyatt’s Hong Kong Office from 2004 to 2007. Mr. Charles has also worked in India as Watson Wyatt’s Benefits Practice Leader for Watson Wyatt India, where he led the integration for a new acquisition. He started his career as a consulting actuary in Watson Wyatt’s Reigate office in 1987 and later became the Operations Manager for the London Benefits team. Mr. Charles was appointed a Partner of Watson Wyatt in Europe in 1999. He is a frequent speaker at conferences on pension reforms, is a Fellow of the Institute of Actuaries (UK) and holds a first class honours degree in mathematics from Oxford University.
David M.E. Dow (age 50) has served as Vice President and Global Practice Director of the Technology and Administration Solutions (TAS) Group since July 2005. Mr. Dow qualified as a Chartered Accountant with KPMG in 1983 and worked for a number of years in the insurance industry before joining The Wyatt Company in 1988 as a consultant. In the 21 years since, Mr. Dow has held various leadership positions in consulting, outsourcing and technology practices. He was Managing Director of Wyatt Financial Services Ltd from 1990 to 1995, Head of Practice of the Financial Services Group of Watson Wyatt Partners from 1995 to 1998, Head of Practice for Benefits Administration Solutions (Watson Wyatt’s UK outsourcing service) from 1998 and has been Vice President and Global Practice Director for TAS since 2005. Mr. Dow also held Partnership Board and Finance Committee roles within Watson Wyatt LLP and in his current role is a member of the firm’s Global Matrix Group and European Matrix Group.
Carl A. Hess (age 47) has served as Vice President and Global Practice Director, Investment Consulting since 2008. Prior to this, Mr. Hess served as Americas Practice Director, Investment Consulting from 2006 and as U.S. East Division’s Investment Practice Leader from 2004 to 2006. Mr. Hess joined Watson Wyatt in 1989 as a senior consulting actuary. Prior to joining Watson Wyatt, he worked for two other consulting firms and an insurance company. Mr. Hess has responsibility for a number of Watson Wyatt’s major investment clients, advising them on all investment issues. He also serves on the board of the Homer Laughlin China Company and its subsidiaries. Mr. Hess is a Fellow of the Society of Actuaries and a Chartered Enterprise Risk Analyst. He has a B.A. degree cum laude in Logic from Yale University.
5
Robert J. McKee (age 47) has served as Vice President and Global Director of Marketing since 2006. Mr. McKee joined Watson Wyatt in 1992 and was named Director of Marketing for Watson Wyatt & Company in 1998. Mr. McKee is responsible for: marketing strategy, planning and research, brand management, marketing communications and public relations, web-based marketing, and sales support. Prior to joining Watson Wyatt, Mr. McKee held marketing and public relations roles at Towers Perrin and at the Guardian Life Insurance Company of America. He has an A.B. degree from Columbia University.
Kevin L. Meehan (age 64) has served as Regional Manager (North America) since 2006, as a Vice President since 1994 and was a Director from 1999 to 2002, and again from 2007 to 2008. Mr. Meehan joined Watson Wyatt in 1983 and was instrumental in developing the company’s flexible benefits operations, our North America Technologies and Administration group and our Account Management function. Over the years Mr. Meehan has led teams that have won some of Watson Wyatt’s largest assignments and has managed some of Watson Wyatt’s largest accounts. Mr. Meehan has been a speaker on employee benefits tax and legal issues, and has testified before the IRS, the Department of Labor and Committees of Congress on these issues on behalf of our clients. Mr. Meehan has a B.A. from the College of the Holy Cross and a J.D. from St. John’s University Law School.
Stephen E. Mele (age 59) has served as Vice President and Chief Human Resources Officer since 2007. Mr. Mele was most recently the Chief People and Technology Officer at Mercer HR Consulting, having previously worked at Prudential International as VP Human Resources. Earlier, he had been the Group Head for Human Resources Operations at Standard Chartered Bank and prior to that was HR Director at Clearstream and at Schlumberger. In particular he has lived and worked in North America, the UK and continental Europe. Mr. Mele received his B.S. in Business Administration from Fairleigh Dickinson University.
Roger F. Millay (age 52) has served as Vice President and Chief Financial Officer of Watson Wyatt since August 2008. Prior to this, Mr. Millay was with Discovery Communications LLC, a global cable TV programmer and digital media provider since 2006, where he served as Senior Executive Vice President and Chief Financial Officer. At Discovery he was responsible for the global financial functions, including accounting, treasury, budgeting, audit and tax. Prior to this, Mr. Millay was Senior Vice President and Chief Financial Officer with Airgas, Inc., an industrial gases and supplies distributor and producer from 1999 to 2006. Mr. Millay has over 25 years of experience in financial officer positions, including roles at Arthur Young & Company, Citigroup, and GE Capital. He holds a B.A. degree from the University of Virginia, an M.S. in Accounting from Georgetown University’s Graduate School of Business and is a Certified Public Accountant.
Peter E. Mills (age 51) has served as Vice President and Regional Manager (Latin America) since 2005, and has been with Watson Wyatt since 1988, most recently as Watson Wyatt’s Latin America Region Retirement Practice Leader. Before that, Mr. Mills was a Senior Consultant for Watson Wyatt in its Latin America and Caribbean region. He worked as a project manager and account manager, and consulted for clients throughout the region. Mr. Mills has over 20 years of professional experience. He graduated from the University of Connecticut in 1980 with a B.S. degree in Mathematics and is a Fellow of the Society of Actuaries, a member of the American Academy of Actuaries, a member of the Actuarial Association of Colombia, and an Enrolled Actuary.
Martin S. Pike (age 48) has served as Vice President and Global Practice Director of Insurance and Financial Services since June 2009, was most recently European Practice Director for the Insurance & Financial Services Practice, and is a member of the Global Practice Management Team. Mr. Pike advises insurers and banks on the full range of services including core actuarial activities and wide ranging strategic advice. Mr. Pike’s client experiences include senior relationship management activities with large clients, M&A transactions; advising a large UK company on the exercise of discretion in the with-profits funds; and restructuring of business operations. Mr. Pike graduated from Oxford University and joined Watson Wyatt in 1983, qualifying as a Fellow of the Institute of Actuaries in 1988.
Paul E. Platten (age 56) has been Vice President and Global Practice Director of the Human Capital Group since 2005 and served as the Managing Consultant for the Boston, Massachusetts office of Watson Wyatt Worldwide from 2003 to 2005. He joined Watson Wyatt in June 2000 as the National Practice Leader of Strategic Rewards, specializing in executive compensation and strategic human resource issues. Mr. Platten has spent more than 20 years working with organizations to develop pay and performance programs that effectively link with strategic goals and cultural values. Prior to joining Watson Wyatt, Mr. Platten was the partner in charge of the PricewaterhouseCoopers LLP Boston Global HR Solutions practice. For 15 years prior to joining PricewaterhouseCoopers, Mr. Platten was part of the Hay Group as Vice President and Managing Director of Eastern Operations. Mr. Platten is a frequent lecturer at the American Bar Association and World at Work. He is co-
6
author of the book People, Performance and Pay, which has been translated into three languages. Mr. Platten holds a B.S. degree in Psychology from Boston College and a Ph.D. degree in Industrial and Organizational Psychology from New York University.
Chandrasekhar (Babloo) Ramamurthy (age 53) has served as Vice President, Regional Manager (Europe) of Watson Wyatt since 2005 and served as a member of Watson Wyatt’s board of directors from 2005 to 2008. He joined The Wyatt Company in 1977. Following the establishment of the global Watson Wyatt Worldwide alliance in 1995, Mr. Ramamurthy became a partner of Watson Wyatt LLP. Mr. Ramamurthy has been based primarily in London, although between 1983 and 1986 he transferred to the international benefits and compensation consulting team based in the New York region, where he dealt primarily with the head offices of U.S. multinational companies. Since returning to Europe, Mr. Ramamurthy has been the account manager for a number of the firm’s major clients in the U.K., advising on a broad range of human capital and employee benefits issues both in the U.K. and overseas. Mr. Ramamurthy was the Head of the European Benefits Consulting Practice from 1999 to 2004, before being appointed Managing Partner of Watson Wyatt LLP in 2004, and has also served on Watson Wyatt LLP’s Partnership Board. Mr. Ramamurthy holds an honours degree in Mathematics from King’s College, London.
Gene H. Wickes (age 56) has served as the Global Director of the Benefits Practice of Watson Wyatt since 2005 and as a member of Watson Wyatt’s board of directors from 2002 to 2007. Mr. Wickes was Watson Wyatt’s Global Retirement Practice Director in 2004 and the U.S. West Division’s Retirement Practice Leader from 1997 to 2004. Mr. Wickes joined Watson Wyatt in 1996 as a senior consultant and consulting actuary. He assists clients with their retirement and executive benefit issues. Prior to joining Watson Wyatt, he spent 18 years with Towers Perrin, where he assisted organizations with welfare, retirement, and executive benefit issues. Mr. Wickes is a Fellow of the Society of Actuaries and has a B.S. in Mathematics and Economics, an M.S. in Mathematics and an M.S. in Economics, all from Brigham Young University.
CORPORATE GOVERNANCE
Corporate Governance Guidelines
Watson Wyatt Worldwide, Inc. is committed to exercising the highest standard of ethical conduct and corporate governance which we believe best serve our stockholders, employees and clients. We have established and adopted Corporate Governance Guidelines for maintaining our ethical standards, as well as, adopting corporate governance practices that form a solid framework for effectively aligning our business objectives. Stockholders may obtain copies of our Codes of Business Conduct and Ethics, the Corporate Governance Guidelines and our Board committee charters on the Company’s website at http://www.watsonwyatt.com/ir or send a request addressed to Watson Wyatt Worldwide, Inc., Office of the Secretary, 901 N. Glebe Road, Arlington, Virginia 22203.
Code of Business Conduct and Ethics
The Company has a Code of Business Conduct and Ethics that applies to all of its employees, including the President and Chief Executive Officer, the Chief Financial Officer and the Controller. The Company also has a Code of Business Conduct and Ethics that applies to all of the Company’s Directors and any amendment or waiver of the Codes for executive officers and Directors will be disclosed on the Company’s website.
Communications with the Board or Presiding Director
It is the policy of the Company to facilitate communications of stockholders and other interested parties with the Board of Directors and the Company’s Presiding Director. Communications to Directors of the Company must be in writing and may be sent to any Director, in care of the Office of the Secretary, Watson Wyatt Worldwide, Inc., 901 N. Glebe Road, Arlington, Virginia 22203. Communications may be sent by email to all Directors as a group or to the Presiding Director using the email addresses posted by the Company on its web site at www.watsonwyatt.com under “Investor Relations.” Communications should identify the person submitting the communication, the interest of such person in the subject matter of the communication, and the address, telephone number and email address of the person submitting the communication. Each communication will be forwarded to the Director(s) to whom it is addressed. The Board has authorized the Company’s Secretary to adopt reasonable procedures for collecting and distributing communications to Directors. If such procedures are adopted, they will be made available on the Company’s website at www.watsonwyatt.com under “Investor Relations.”
7
Presiding Director
The Company’s Board of Directors has designated R. Michael McCullough as the Presiding Director of all executive sessions of the independent Directors of the Board.
Nominees for Director
The Nominating and Governance Committee makes recommendations to the Board concerning individuals who are qualified to stand for election as Directors. The Nominating and Governance Committee seeks individuals with a broad and diverse range of skills who have demonstrated the highest levels of personal and business integrity and sound business judgment, particularly in professional services industries. The Nominating and Governance Committee will consider suggestions of possible nominees for Director from the Board of Directors and management, and may in the future retain a search firm to assist it in identifying possible nominees for Director.
The Nominating and Governance Committee also will consider recommendations of possible nominees for Director submitted by stockholders. Recommendations may be submitted to any member of the Nominating and Governance Committee in care of the Office of the Secretary, Watson Wyatt Worldwide, Inc., 901 N. Glebe Road, Arlington, Virginia 22203. Candidates recommended by stockholders will be evaluated in the same manner as other candidates considered by the Nominating and Governance Committee.
Standing Committees of the Board
The Company has three standing committees: Audit, Compensation and Nominating and Governance. These committees operate pursuant to written charters adopted by the Board of Directors. The Company also has a Risk Management Committee consisting of six members, three of which are independent directors.
Audit Committee
The Audit Committee’s principal responsibilities, as set forth in its charter, are to assist the Board in overseeing the Company’s financial reporting process that is established and implemented by management. The Audit Committee oversees the work of the independent registered public accounting firm and also reviews information provided by the Company’s Director of Internal Audit, independent registered public accounting firm, and management concerning internal accounting procedures and controls.
The Audit Committee is currently composed of four independent Directors, John J. Gabarro, R. Michael McCullough, Gilbert T. Ray and John C. Wright (Chair), all of whom meet the current independence requirements of NYSE and NASDAQ’s listing standards. The Board of Directors has determined that Mr. Wright is both independent and an audit committee financial expert, as defined by SEC guidelines and NYSE and NASDAQ listing standards. The Audit Committee held eight meetings during fiscal year 2009.
Compensation Committee
The Compensation Committee oversees executive compensation policies, including the compensation of the Chief Executive Officer (“CEO”), and oversees administration of the 2001 Employee Stock Purchase Plan, the 2001 Deferred Stock Unit Plan for Selected Employees, the Watson Wyatt Performance Share Bonus Incentive Program and the 2000 Long-Term Incentive Plan. The Board has delegated to the Compensation Committee matters associated with succession planning for the CEO. The Compensation Committee currently is composed of John J. Gabarro, Brendan R. O’Neill, Linda D. Rabbitt and Gilbert T. Ray (Chair), all independent Directors, and all of whom meet the independence requirements of the NYSE and NASDAQ’s listing standards. The Compensation Committee held six meetings during fiscal year 2009.
Nominating and Governance Committee
The Nominating and Governance Committee provides assistance to the Board of Directors of the Company in fulfilling its responsibilities: by identifying individuals qualified to become Directors and approving the nomination of candidates for all Directorships to be filled by the Board of Directors or by the stockholders of the Company; identifying Directors qualified to serve on the committees established by the Board of Directors and recommending to the Board of Directors members for each committee to be filled by the Board of Directors; maintaining and reviewing the Corporate Governance Guidelines; and otherwise taking a leadership role in shaping the corporate governance of the Company.
8
The Nominating and Governance Committee currently is composed of R. Michael McCullough (Chair), Brendan O’Neill, Linda D. Rabbitt and John C. Wright, all independent Directors, and all of whom meet the independence requirements of the NYSE and NASDAQ’s listing standards. The Nominating and Governance Committee held five meetings during fiscal year 2009.
Board Meetings
The Board of Directors conducted eleven meetings during fiscal year 2009. All Directors attended 75 percent or more of the meetings of the Board and the committees on which they served.
Meetings of Non-Employee Directors
The non-employee Directors met without any management Directors or employees present two times last year to discuss board policies, processes and practices. The Presiding Director, who is also the Chair of the Nominating and Governance Committee, chaired these meetings.
Annual Meeting Attendance
All Directors attended the 2008 Annual Meeting of Stockholders. All Directors are expected to attend the annual meeting of the Company’s shareholders.
EXECUTIVE COMPENSATION
Compensation Discussion and Analysis
Executive Summary
Our Compensation Discussion and Analysis will provide you with an overview and analysis of (i) our compensation programs and policies for certain of our executive officers identified below; (ii) the material compensation decisions made by the Compensation Committee (the “Committee”) of the Board of Directors under those programs and policies as reflected in the executive compensation tables that appear following this Compensation Discussion and Analysis; and (iii) the material factors that the Committee considered in making those decisions.
The Company’s executive compensation philosophy and the elements of our executive compensation program with regard to fiscal year 2009 are summarized below:
· The main objectives of the Company’s executive compensation program are attracting, motivating and retaining the best executives and aligning their interests with our strategy of maximizing stockholder value.
· Total direct compensation under the Company’s executive compensation program consists of base salary, supplemental performance-based awards in the form of fiscal year-end bonuses, and long-term incentive opportunities.
· The Committee is responsible for evaluating and setting the compensation levels of our executive officers. In setting compensation levels for executives other than the CEO, the Committee solicits the input and recommendations of our CEO, John J. Haley.
· Total target and actual direct compensation levels for the Company’s named executive officers compare lower than those of its peer group, primarily because of lower long-term incentive targets but also because of lower annual incentive targets. Because the Company’s executive compensation program has higher fixed elements such as base salaries and pension value, it has lower incentive elements. As a result, this has led the Committee to target total direct compensation lower than other companies of our size with similar performance.
· During fiscal year 2009, the Company operated in the midst of the worst recession since the Great Depression, which resulted in a worldwide economic slowdown, a freeze in available credit markets, and a crisis in confidence on a global scale. In spite of these challenges, the Company achieved the second best operating results in the Company’s history. Revenues were $1.68 billion, up 3 percent on a constant
9
currency basis, and net income for the year was $146.5 million, or $3.42 per diluted share. Constant currency adjusted earnings per share, excluding severance, increased 11 percent from $3.50 in fiscal year 2008 to $3.89 in fiscal year 2009. The Company managed strong profit margins of more than 12 percent and had zero debt as of June 30, 2009.
· Revenue growth and earnings per share are the primary quantitative metrics used by the Committee to determine long-term incentive compensation earned during the applicable three-year performance periods designated by the Committee for measuring long-term performance. For performance shares that vested at the end of fiscal year 2009, the compensation decisions reported herein reflect the Company’s performance above target with respect to both metrics for the three-year performance period ending June 30, 2009.
· Based on the Company’s sustained performance year over year relative to its peer group and the respective individual accomplishments of our named executives during fiscal year 2009, the Committee deemed it appropriate for fiscal year-end bonuses for our named executives for fiscal year 2009 to be demonstrably higher than target. In addition, certain named executives received a one-time transaction bonus in recognition of significant and extraordinary efforts made by those executives in negotiating and executing the pending merger agreement with Towers Perrin.
· The Committee will continue to consider all relevant competitive factors in determining compensation for our named executive officers.
Named Executives
Under the heading “Executive Compensation,” we present a series of tables containing specific information about the compensation earned or paid in fiscal year 2009 to the following individuals, whom we refer to as our named executives:
· John J. Haley, President, Chief Executive Officer, Chairman of the Board and Director
· Roger F. Millay, Vice President and Chief Financial Officer
· Carl D. Mautz, former Vice President and Chief Financial Officer
· Gene H. Wickes, Vice President and Global Director of the Benefits Practice
· Kevin L. Meehan, Vice President and Regional Manager (North America)
· Walter W. Bardenwerper, Vice President, Secretary and General Counsel
Mr. Mautz retired from the Company effective August 29, 2008. He was replaced by Mr. Millay, who started with the Company on August 18, 2008.
The discussion below is intended to help you understand the detailed information provided in those tables and to put that information into context within our overall compensation program.
Objectives of Our Executive Compensation Program
The objectives of our executive compensation program are to:
1. Attract, motivate and retain the most highly qualified and capable executives by providing competitive compensation based on individual and Company performance and reflecting our mix of compensation elements.
We seek to compensate all of our executives fairly on a global basis and on a basis that reflects the Company’s performance relative to its key competitors. Toward this end, we provide competitive base compensation, supplemented with variable compensation based on individual achievement of annual results and, for select senior executives, long-term results. As discussed below, we tie both annual and long-term compensation to quantitative and qualitative performance assessments that impact our success in the marketplace.
10
2. Align executive compensation with the Company’s overall business strategies and values.
We apply our compensation objectives to all of our executives. In implementing our compensation objectives, we take into consideration the Company’s business strategy and prevailing market conditions. Specifically, our executive compensation program is designed to reinforce business goals identified through our PerformanceExcellence process and our Horizon initiatives.
Our PerformanceExcellence process is an annual three-phase performance management cycle composed of planning, a mid-year review and a year-end review. It is designed to (a) align our employees’ (whom we refer to as our associates) performance goals to our business priorities; (b) develop their ability to achieve their goals; and (c) recognize and reward their business results based on fair and accurate measurement.
Horizon is the Company’s strategic plan for attaining its vision of market leadership in the human capital consulting profession. Factors included in the strategic plan take into account our market share gains, the prioritization and allocation of our financial investments and resources based on contribution to market leadership, effectiveness in enhancing our organizational structure, and the achievement of strategic acquisitions.
3. Focus management on maximizing stockholder value.
We also believe that the best way to directly align the interests of our named executives with the interests of our stockholders is to ensure that our named executives acquire and retain an appropriate level of stock ownership throughout their careers with us. In fiscal year 2009, our compensation program pursued this specific objective in three ways: (i) through our Performance Share Bonus Incentive Program (discussed below); (ii) by paying 25 percent of annual fiscal year-end bonuses to our named executives and other senior executives in the form of Company stock; and (iii) through our stock ownership guidelines for our named executives, as described in more detail below.
4. Foster an ownership approach among our executives and reward their focus on long-term objectives.
For our named executives, a portion of their fiscal year 2009 total direct compensation was delivered through our Performance Share Bonus Incentive Program, which is a long-term performance-based arrangement that pays out in Company stock based on the achievement of performance goals over a three-year period. The Performance Share Bonus Incentive Program combines the elements of basing compensation on corporate performance, focusing on stockholder value, and rewarding long-term results.
When implementing our compensation program, the level of our named executives’ compensation is determined primarily based upon (a) an internal pay equity analysis that takes into account the named executive’s level of responsibility and function within the Company; (b) the extent to which the named executive has helped drive the achievement of financial and strategic goals that impact stockholder value; (c) the overall performance and profitability of the Company; and (d) our assessment of the competitive marketplace, including a comparison against what we deem to be our peer group of companies. We do not maintain employment agreements with any of the named executives.
How We Determine and Assess Executive Compensation
The Compensation Committee is responsible for evaluating the compensation levels for each of the named executives of the Company and for administering the Company’s cash- and equity-based incentive plans. The Committee engages an independent compensation consultant, Frederic W. Cook & Co., Inc. (“Frederic Cook”) and, in setting compensation levels for executives other than the CEO, solicits the input and recommendations of our CEO, John Haley. Frederic Cook periodically reviews the Company’s total compensation philosophy, target peer group and target competitive positioning for reasonableness and appropriateness; conducts competitive analyses of executive compensation for the chosen peer group and reports on its findings to the Committee; and reviews the Company’s total executive compensation program on behalf of the Committee, in consultation with management, and advises the Committee of changes that could be made to better reflect evolving best practices and improve effectiveness. For fiscal year 2009, the Compensation Committee instituted a formal process for conducting an annual assessment of its independent compensation consultant.
11
In making its determinations, the Committee relies on publicly available information, commissioned survey data, and its knowledge of the market for key executives. The Compensation Committee takes this peer data information into account and generally seeks to provide competitive pay by targeting total actual compensation opportunities for our named executives between the 50th and 75th percentiles relative to a peer group. However, the Compensation Committee does not target a particular peer group percentile for particular elements of compensation. The peer group was selected by the Compensation Committee based on the recommendations of Frederic Cook and input from management on the comparability of the business operations of potential peer group companies, and is re-evaluated annually.
The peer group companies include those few public companies with human resources consulting lines of business. Because many of the Company’s direct competitors are privately owned (e.g., Towers Perrin and the Hay Group) or are subsidiaries of larger public companies (e.g., Mercer Human Resource Consulting and Buck Consultants), the number of direct competitors for which public information is available for peer group comparison is limited. Therefore, additional peer group companies in the consulting, staffing and professional services businesses are selected using the following criteria: (a) reasonably comparable size (based on revenue and market capitalization); (b) positive earnings before interest, taxes, depreciation and amortization (EBITDA); (c) high human capital/low financial capital business model; (d) creative/innovative business product; (e) highly skilled employee base; (f) deemed a “comparable” by securities firms providing research coverage; and (g) global reach.
For conducting a competitive assessment of the compensation levels of each of its named executives in fiscal year 2009, the Compensation Committee approved a peer group of ten companies, with two changes from the peer group used in the prior fiscal year. Hudson Highland, which was a “primary” company in the prior fiscal year, was dropped because it is now primarily a staffing firm. Resources Connection was moved up to the “primary” sub-set. Frederic Cook presented the Committee with competitive compensation comparisons for the Company’s fiscal year 2008 actual total compensation and fiscal year 2009 target compensation against competitive 2008 actual and target compensation for the peer group companies. Comparisons were made separately by Frederic Cook against the five “primary” companies considered to be most similar to the Company, as well as against the combined peer group. The 10 companies comprising the combined peer group for fiscal year 2009 are as follows:
|
Primary Peers |
|
Secondary Peers |
|||
|
· |
FTI Consulting |
|
· |
|
Aon |
|
· |
Hewitt Associates |
|
· |
|
CIBER |
|
· |
Navigant Consulting |
|
· |
|
Convergys |
|
· |
Perot Systems |
|
· |
|
Gartner |
|
· |
Resources Connection |
|
· |
|
Huron Consulting |
|
|
|
Position Relative to Watson Wyatt (Based on Fiscal Year 2008 Data) |
|
|||||
|
|
|
Annual Revenue |
|
Market Capitalization |
|
Number of |
|
|
|
Median Size: Primary |
|
2,036 |
|
1,652 |
|
11,683 |
|
|
|
Median Size: Combined |
|
1,293 |
|
1,423 |
|
8,400 |
|
|
|
|
|
|
|
|
|
|
|
|
|
· |
Watson Wyatt |
|
1,760 |
|
2,038 |
|
7,230 |
|
Watson Wyatt is above median in size (average percentile rank of 60% when measured in terms of revenue, earnings before interest, taxes, depreciation and amortization, total assets, market capitalization and number of employees) compared to the combined peer group. The combined peer group was used for this purpose because it was determined that there are too few companies in the primary peer group to calculate meaningful percentile ranks. An analysis performed for the Company by Frederic Cook compared the compensation percentile ranks for our named executives versus the combined peer group based on 2008 data. The analysis revealed that the Company’s base salaries for named executives continued to compare above median, which the Committee believes is appropriate given the Company’s percentile rank based on average size. The competitiveness of target bonuses for our named executives varied by position and they are generally less competitive than our base salaries, but are sufficient to result in actual total cash compensation that is above median when our performance is above median.
12
The value of long-term incentive compensation compared low, generally falling between the 25th percentile and the median, with the result that total direct compensation was at or below the median for most of our named executives. However, Watson Wyatt is one of only a few companies in our combined peer group with a defined benefit pension plan. Taking into account both the change in pension value and actual total direct compensation generally increases the competitiveness of the Company’s actual total compensation to above median and, in some cases, above the 75th percentile.
In light of its determination regarding actual total compensation, the Committee determined that total direct compensation for our named executives should continue to be positioned near, but below, the median. As a result, the Committee did not increase target annual and long-term incentive levels for fiscal year 2009. However, based on its post-year-end review of the Company’s sustained positive performance in fiscal year 2009, the Committee concluded that the annual year-end bonuses for our named executives generally should exceed target in order to reflect their strong performance during the fiscal year.
Elements of Our Executive Compensation Program
Our executive compensation program consists primarily of the following integrated components: base salary, supplemental performance-based awards in the form of fiscal year-end bonuses, and long-term incentive opportunities, which together make up a named executive’s total direct compensation for a given fiscal year. The only component not available to all associates is the long-term incentive opportunity.
The process for determining Mr. Haley’s salary and fiscal year-end bonus is discussed in more detail on page 18. In determining base salary increases and fiscal year-end bonus payments for the named executives other than Mr. Haley, the Committee asks for recommendations from Mr. Haley. In making his recommendations for the named executives, Mr. Haley reviews each named executive’s performance against their individual PerformanceExcellence goals. For our named executives, these goals consist primarily of objectives addressing the financial performance and effective management of their respective business practice, region or corporate function. While this process reflects a methodical approach to evaluating the job performance of our named executives, achievement of these goals is evaluated subjectively and scored in four weighted performance domains, as described below in the discussion relating to fiscal year-end bonuses. In making his recommendations, Mr. Haley also takes into consideration the named executive’s experience, the extent to which the named executive has contributed to the Company’s success during the fiscal year, the named executive’s expected level of responsibility in the coming year, base salary and bonus pool levels for the Company as a whole, peer group competitive data and relative pay levels of other Watson Wyatt associates. The following discussion will describe each of the components that comprise the total direct compensation of our named executives.
Base Salary
In order to provide a fixed level of compensation for the performance of an executive’s regular duties, the Company pays all of its named executives a fixed, annual base salary, which the Committee reviews and approves at the beginning of each fiscal year and which becomes effective on October 1 of each year. Base salary decisions are highly discretionary, and we do not target base salary as a particular percentage of total compensation. Mr. Haley makes salary recommendations to the Committee for the named executives other than himself.
Based upon the qualitative evaluation process discussed above, in conjunction with a review of competitive peer group survey data, Mr. Haley recommended salary increases for fiscal year 2009 for Messrs. Wickes and Meehan of 4.5% and for Mr. Bardenwerper of 4.2% that became effective October 1, 2008. In making these recommendations, the principal factors that Mr. Haley considered were the Company’s overall financial results for fiscal year 2008, the individual performance of each executive during the fiscal year and salary levels of similarly positioned executives in the Company’s primary peer group. Mr. Mautz did not receive a salary increase as he retired from the Company prior to October 1, 2008. Mr. Millay did not receive a salary increase effective October 1, 2008, as he had started with the Company just prior to that time. Mr. Haley discussed each recommendation with the Committee and, thereafter, the Committee approved the recommended salary increases.
13
A similar process was followed for determining the base salaries for the named executives other than Mr. Haley effective October 1, 2009. Because of general economic conditions and a desire to be prudent. Mr. Haley recommended that base salaries for all named executives remain unchanged effective October 1, 2009, and the Committee agreed with his recommendation. As discussed below, Mr. Haley’s base salary remained unchanged, as did the base salaries for the named executives other than Mr. Haley.
Fiscal Year-End Bonuses
The Company’s named executives participate in an annual fiscal year-end bonus program, which the Company provides in order to supplement base salary and reward achievement of individual, business unit/function and/or overall Company results for the most recently completed fiscal year. Pursuant to this program, each named executive is assigned a pre-determined bonus target as a percentage of base salary as shown in the table below:
|
Name |
|
Target Bonus Percentage |
|
|
John Haley |
|
100.0 |
% |
|
Roger Millay |
|
62.5 |
% |
|
Carl Mautz |
|
62.5 |
% |
|
Gene Wickes |
|
62.5 |
% |
|
Kevin Meehan |
|
62.5 |
% |
|
Walter Bardenwerper |
|
62.5 |
% |
Target bonus levels for our named executives are based on their respective band levels, which generally reflect their level of responsibilities and contributions to the business. Target bonus percentage increases as an associate’s band level increases. This reflects a belief that as associates move to higher levels of responsibility with greater ability to influence the Company’s results, a higher proportion of pay should be determined to be “at risk” and dependent on Company and individual performance. Mr. Haley’s target is higher than for the other named executives in order to reflect his greater level of responsibility and how critical his contributions are to the success of the Company.
The amount of fiscal year-end bonuses awarded as a percentage of target is discretionarily determined. Following the end of fiscal year 2009, Mr. Haley evaluated the performance of each of the other named executives by scoring their performance in four weighted performance domains, as follows: (i) Business practice, region or Corporate function (representing a qualitative assessment of financial and individual performance in leading their respective practice, region or Corporate function) — 50%; (ii) Watson Wyatt (representing a subjective judgment of their contribution to the Company as a whole during the fiscal year) — 25%; (iii) Other goals (representing individual goals that were developed through our PerformanceExcellence process) — 15%; and (iv) Global Matrix Group (GMG) participation (representing their contribution as a member of the Company’s GMG) — 10%. Mr. Haley assigned a rating to each of the other named executives for each performance category, which was then applied against the weighting for the particular category and totaled for each of the named executives to arrive at an overall performance rating for the fiscal year utilizing a six-point scale. A named executive’s actual bonus is based on this rating and the named executive’s applicable bonus funding percentage. The bonus funding percentage is the percentage of the Company-wide bonus pool that is subjectively allocated to each applicable practice, region or Corporate function as a result of their performance during the fiscal year.
In making his recommendations within the framework discussed above, Mr. Haley took into account each named executive’s responsibilities and accomplishments during the fiscal year. In addition to the sustained positive performance of the Company in fiscal year 2009 relative to its peers, the bonus recommendations provided to the Committee by Mr. Haley took into account the following qualitative assessment of each named executive’s performance during the fiscal year.
Mr. Millay successfully transitioned into his role as the new Chief Financial Officer of the Company and efficiently and effectively oversaw the Company’s adherence to the highest standards of financial reporting and controls. He led the development of improved processes and reporting capabilities within the global finance and accounting functions, while at the same time providing strong operational support and guidance to senior management and the Board of Directors.
14
Mr. Wickes, as the leader of the Company’s largest practice, managed to guide the Benefits Practice to a successful year in the midst of a global economic crisis and deteriorating market conditions. Pre-tax net operating income for the Benefits Practice reached an all-time high, and the annual organic, constant currency growth rate for the practice was strong, especially when considering the global economic environment.
Mr. Meehan, like Mr. Wickes, adapted well to rapidly changing and deteriorating market conditions and led our North America region to a strong performance in fiscal year 2009. The North America region effectively managed its costs, preserved its operating margins and was our most profitable region.
Mr. Bardenwerper provided critical leadership in helping the Company through the economic crisis. He also made significant strides in guiding the Company through the regulatory and litigation challenges facing it and provided valuable support to senior management and the Board of Directors.
All of the named executives other than Mr. Haley were rated by Mr. Haley as a “5 – Very Strong Performance,” corresponding to a suggested bonus range of 115% to 135% of target based on the named executives’ applicable bonus funding percentage. Based on these performance ratings, Mr. Haley recommended annual bonuses ranging from 118.7 percent to 138.9 percent of target for the other named executives, as set forth below.
|
Name |
|
Area |
|
Bonus as a |
|
|
Millay |
|
F&A |
|
118.7 |
% |
|
Mautz |
|
F&A |
|
N/A |
|
|
Wickes |
|
Benefits Practice |
|
138.9 |
% |
|
Meehan |
|
North America |
|
133.6 |
% |
|
Bardenwerper |
|
General Counsel |
|
131.5 |
% |
Because Mr. Mautz retired from the Company effective August 29, 2008, he did not receive a fiscal year-end bonus for fiscal year 2009.
Mr. Haley discussed each recommendation with the Committee. The Committee has the discretion to increase or decrease each of these amounts (though not above the maximum incentive award established by the Committee, described under “Tax and Accounting Treatments of Elements of Compensation” below), but determined to approve all of the recommended payouts without adjustment.
In order to facilitate stock ownership by associates at our most senior levels, we have an equity incentive feature of our bonus program under which 25 percent of the total bonus awarded is delivered in the form of Company stock under the Company’s 2001 Deferred Stock Unit Plan for Selected Employees, which could vest based on the discretion of the Committee over two years. The number of shares granted is based on the closing share price on the grant date, which is the bonus payment date. Consistent with past practice, the Committee exercised its discretion to grant fully vested shares for fiscal year 2009.
Transaction Bonuses
Mr. Haley also made recommendations to the Committee for special one-time cash bonuses to a select number of executives, including some of the named executives, in recognition of the significant and extraordinary efforts made by those executives in negotiating and executing the pending merger agreement with Towers Perrin. The Committee noted that the exceptional fiscal year 2009 results discussed above for the Company were achieved within the same time period as the Company’s Chief Executive Officer, the Chief Financial Officer, the General Counsel and the Global Director of the Benefits Practice were successfully negotiating the largest merger in the history not only of the Company itself, but of the human capital/actuarial industry as a whole.
Mr. Wickes, Mr. Bardenwerper and Mr. Millay took an active role throughout the lifecycle of the deal and devoted a significant amount of time and effort in helping to negotiate the terms of the merger agreement. Mr. Millay and Mr. Bardenwerper also both played key roles in leading the due diligence function and providing assistance in finalizing
15
the contractual terms of the merger. Accordingly, following discussions of the time and effort exerted by each named executive, the Committee approved the recommendations of Mr. Haley for special one-time cash bonuses in the amount of $150,000 for Mr. Millay, $200,000 for Mr. Wickes and $200,000 for Mr. Bardenwerper.
Long-Term Incentive Compensation: Performance Share Bonus Incentive Program
In fiscal year 2009, our named executives received long-term incentive compensation under our Performance Share Bonus Incentive Program (the “SBI Program”). The SBI Program advances our executive compensation objectives by rewarding the achievement of strategic performance objectives with equity awards. As a result, the Committee weighted our SBI Program so that it provides a significant portion of our named executives’ total direct compensation opportunity.
The target number of deferred stock units that may be earned by the named executives under the SBI Program represents a multiple of the cash portion (75 percent) of the named executive’s target bonus for the year of grant, with the multiples ranging from 2.0 for Mr. Haley to 1.25, 1.0 or 0.75 for the other named executives. Mr. Haley’s multiple is higher because his leadership is considered by the Committee to be critical to the Company. Mr. Millay’s multiplier, while not as high as Mr. Haley’s, is higher than for the other named executives in order to reflect the importance of his role as Chief Financial Officer. Mr. Bardenwerper’s multiplier is lower than the remaining named executives to reflect the fact that he is not a member of the Global Matrix Group. The following table shows how the number of deferred stock units granted in fiscal year 2009 under the SBI Program was determined for each of the named executives, for the performance period beginning July 1, 2008 and ending June 30, 2011.
|
LAST NAME |
|
BASE |
|
FISCAL |
|
PORTION |
|
CASH |
|
MULTIPLIER |
|
FULL
CASH |
|
STOCK |
|
NUMBER |
|
||||
|
HALEY |
|
$ |
915,000 |
|
100.0 |
% |
75.0 |
% |
$ |
686,250 |
|
2.00 |
|
$ |
1,372,500 |
|
$ |
52.89 |
|
25,951 |
|
|
MILLAY |
|
$ |
550,000 |
|
62.5 |
% |
75.0 |
% |
$ |
257,813 |
|
1.25 |
|
$ |
322,266 |
|
$ |
52.89 |
|
6,094 |
|
|
WICKES |
|
$ |
575,000 |
|
62.5 |
% |
75.0 |
% |
$ |
269,531 |
|
1.00 |
|
$ |
269,531 |
|
$ |
52.89 |
|
5,097 |
|
|
MEEHAN |
|
$ |
575,000 |
|
62.5 |
% |
75.0 |
% |
$ |
269,531 |
|
1.00 |
|
$ |
269,531 |
|
$ |
52.89 |
|
5,097 |
|
|
BARDENWERPER |
|
$ |
500,000 |
|
62.5 |
% |
75.0 |
% |
$ |
234,375 |
|
0.75 |
|
$ |
175,781 |
|
$ |
52.89 |
|
3,324 |
|
See note 1 to the table on Grants of Plan-Based Awards in Fiscal 2009 on page 24 for more information on the formula to be used to determine the amount payable based on results for the fiscal 2009 through 2011 performance period.
The number of deferred stock units earned is based upon the extent to which the Company meets certain performance goals set at the beginning of the three-year performance period. For the fiscal 2007 through 2009 performance period, the fiscal 2008 through 2010 performance period, and the fiscal 2009 through 2011 performance period, the Committee set financial metrics for the SBI Program because it concluded that such metrics accurately reflected the strategic performance goals for the Company and are aligned with the interests of the Company’s stockholders. The financial metrics for each of the three-year SBI Program performance periods are earnings per share growth and organic revenue growth. For significant foreign operations, revenue for use in the revenue growth calculations reflects a constant currency exchange between the local currency and the U.S. dollar.
Based on the extent to which financial metrics are achieved over a three-fiscal-year period, participants vest in between zero and 170 percent of the target number of deferred stock units, with a threshold vesting level set at 30 percent of target. Dividend equivalents are credited only on stock units that ultimately vest.
16
See note 2 to the Stock Vested During Fiscal Year 2009 table on page 27 for information on the formula used to determine the amount payable and the results for the fiscal 2007 through 2009 performance period.
The fiscal year 2008 and fiscal year 2009 SBI Program documents indicate that the Committee shall accelerate the determination of vesting of awards and provide for their immediate settlement in stock or cash in connection with a change in control, subject to the Committee’s authority to assure fair and equitable treatment of participants in the SBI Program.
Accordingly, on September 4, 2009, the Committee determined that, upon and subject to consummation of the proposed merger between Watson Wyatt Worldwide, Inc. and Towers, Perrin, Forster & Crosby to form a new, publicly listed company called Towers Watson & Co. (the “Merger”), the fiscal 2008 SBI Program awards shall not vest, with the effect that nothing will be earned or paid under those awards and the awards will be forfeited, but the fiscal 2009 SBI Program will vest at 100% of target. In reaching these determinations, the Committee assessed performance to date and projections of performance. As a result of these evaluations, the Committee concluded that it is not likely that the Company will achieve the fiscal year 2008 to 2010 minimum performance metrics. With respect to the fiscal 2009 to 2011 performance period, the Committee determined that it is appropriate to settle the awards at target in order to treat participants fairly, retain key talent, and take account of the fact that the level at which performance metrics may be met at the time of the Merger will be uncertain, as the performance period would be only halfway completed as of December 31, 2009, the projected date of the Merger.
As a result, the following number of shares of Towers Watson & Co.’s Class A common stock, plus dividend equivalents that will have accrued, will be paid to the Company’s named executives for their vested fiscal 2009 SBI Program awards upon consummation of the Merger: Mr. Haley - 25,951; Mr. Millay - 6,094; Mr. Wickes - 5,097; Mr. Meehan - 5,097; and Mr. Bardenwerper - 3,324.
Also, in light of the pending Merger, the Committee determined to grant nonqualified stock options as incentive compensation in lieu of establishing awards under the SBI Program for fiscal 2010. The options were granted on September 9, 2009 under the Company’s 2000 Long-Term Incentive Plan. The options were granted to high-performing senior executives of the Company, including the named executives, who otherwise would have been selected by the Committee to receive SBI Program awards as a result of the executives having direct impact on or responsibility for driving strategy throughout the Company. In light of the anticipated timing of the Merger, the Committee granted options with a Black-Scholes value equal to approximately one-half of the target value of grants under the SBI Program. The options have a seven year term and will vest ratably over each of the three years following the date of grant, provided that upon a change in control of the Company, including the Merger, the options become fully exercisable. The options have an exercise price equal to the grant date market price of the Company’s common stock ($42.47), so that participants will be able to realize value under their options only to the extent that the options become vested and the value of the Company’s stock price, or the share-equivalent value of Towers Watson common stock following the Merger, appreciates. The options otherwise will expire to the extent that they are unvested upon a participant’s termination of employment for reasons other than death, disability, retirement or termination without cause. The number of options granted to each of the named executives was as follows: Mr. Haley – 55,530; Mr. Millay - 13,042; Mr. Wickes – 10,908; Mr. Meehan – 10,908; and Mr. Bardenwerper - 7,114.
Equity Award Policies
As discussed above, in fiscal year 2009 we paid a portion of annual fiscal year-end bonuses in the form of stock and also awarded stock under the SBI program for the fiscal 2007 through 2009 performance period. The calculations of the amount of equity to be awarded are performed as of the last business day preceding the bonus payment date, in the case of annual fiscal year-end bonuses, and as of the last day of the preceding fiscal year, in the case of the SBI Program. The timing of these calculations is fixed in advance so as to eliminate the opportunity for taking advantage of material nonpublic information.
17
Base Salary and Bonus for the Chief Executive Officer
Mr. Haley’s base salary from October 1, 2008 to September 30, 2009 was $915,000, an increase of $40,000, or 4.6 percent over his previous year’s base salary of $875,000. Effective October 1, 2009, Mr. Haley’s annual base salary remained unchanged at $915,000. In determining to leave Mr. Haley’s base salary unchanged, the principal factors that the Compensation Committee considered were salary levels of CEOs in the Company’s peer group, general economic conditions and the desire to be consistent with the treatment of the other named executives.
The Committee recommended, and the Board of Directors approved, a bonus ($1,281,000) equal to 140 percent of Mr. Haley’s target bonus. Below are Mr. Haley’s fiscal year 2009 performance goals, which were the principal factors taken into account in determining Mr. Haley’s bonus.
1. Meet the fiscal year 2009 financial plan for revenue of $1.875 billion, Net Operating Income of $478 million, and Earnings Per Share of $3.84. For significant foreign operations, the calculation of fiscal year 2009 revenue, Net Operating Income and Earnings Per Share reflects a constant currency exchange between the local currency and the U.S. dollar from fiscal year 2008 to fiscal year 2009.
2. Make sure that the Insurance & Financial Services Practice meets fiscal year 2009 financial plan for revenue of $125 million ($119 million in fiscal year 2008) and Net Operating Income of $10 million, or 8% ($2 million, or 2% in fiscal year 2008). For significant foreign operations, the calculation of fiscal year 2009 revenue, Net Operating Income and Earnings Per Share reflects a constant currency exchange between the local currency and the U.S. dollar from fiscal year 2008 to fiscal year 2009.
3. Champion and monitor the Diversity Program.
4. Continue to develop succession planning for the CEO and top business leaders and instill a succession process and culture in the organization.
5. Work with the new CFO to drive continued enhancement in financial reporting processes.
6. Use Horizon strategy to drive Company actions and plans. Continue to ensure that strategy is consistent with current and future needs.
The Committee determined that Mr. Haley did not meet the financial plan for fiscal year 2009, but that he did meet or exceed his other goals for fiscal year 2009, and that financial performance was strong in light of the difficult economic environment. In making its bonus decision, the Committee also considered the results of an internal CEO 360 evaluation of Mr. Haley by his direct reports and the Board of Directors in which Mr. Haley scored very favorably in almost all categories.
Mr. Haley’s compensation level is significantly higher than that of the other named executives. The Committee believes this is appropriate given:
a. His years of experience in the human capital consulting industry;
b. His lengthy tenure and consistently superior performance as CEO of the Company;
c. His level of responsibility and the significance and critical nature of his contributions to the success of the Company; and
d. The growth and performance of the Company under his leadership.
Severance Benefits
The Company has not entered into employment agreements with its named executives. The Company also does not maintain a broad-based severance plan. As a result, the Company is not obligated to pay severance in the event of an involuntary termination of employment of one of its named executives. However, because the SBI Program represents a significant percentage of our named executives’ total direct compensation opportunity, the Committee retains the discretion to determine whether and how to adjust outstanding SBI Program awards in the event of a termination of employment. In connection with Mr. Mautz’s retirement from the Company effective August 29, 2008, the Committee, in the exercise of such discretion, determined that Mr. Mautz should vest in his fiscal year 2007 and fiscal year 2008 SBI Program awards at the same time and to the same extent as other SBI Program participants, dependent upon the achievement of relevant Company metrics for each of the applicable three-year performance periods. The plan under which the SBI Program is conducted also states that upon a change in control,
18
the Committee shall accelerate the vesting of awards, subject to the Committee’s authority to assure fair and equitable treatment of participants.
The Company also maintains severance pay guidelines for associates, which would include the named executives. The guidelines are completely discretionary in the event of a termination of employment, and for any termination, the amount paid by the Company may vary. The guidelines provide for severance pay in an amount equal to two weeks pay for each full year of the named executive’s service, up to a maximum of 24 weeks’ pay, or an amount equal to one week’s pay for each full year of service, whichever is greater, payable in a lump sum upon termination. Any severance benefits payable to a named executive in such circumstances would be entirely discretionary and would be determined by the Company on an individual basis with the approval of the Committee.
Retirement and Savings Plan Benefits
Retirement Plans
The named executives participate in a defined benefit plan available to Watson Wyatt associates in the United States. The Company’s sponsorship of such a plan is consistent with our belief that defined benefit plans continue to represent a crucial and viable means for us to provide for the future retirement security of our employees and to encourage sustained service to the Company. The plan benefits are based upon years of service with the Company and the highest consecutive 60-month average of total pay, which includes base pay and bonus. More details regarding the defined benefit plan are included in the discussion following the Pension Benefits table on page 28.
Savings Plans
Our named executives are also eligible to participate in the 401(k) plan available to Watson Wyatt associates in the U.S. and in a non-qualified plan designed to permit employees impacted by Internal Revenue Code (IRC) limitations on annual contributions to 401(k) plans to continue to receive Company matching contributions as if salary deferrals had continued once they exceeded the IRC limitations.
Non-Qualified Retirement Plans
The Company also sponsors non-qualified defined benefit and defined contribution retirement plans for our highly compensated executives, including our named executives in the United States, which provide benefits in excess of IRC limits. The purpose of these plans is to provide our senior executives with the retirement benefits they would have received in the absence of the IRC limitations.
Employee Welfare Benefit Plans
Our named executives are eligible for medical, life insurance and other welfare benefits available to other Watson Wyatt associates, depending upon the region in which they are located. There are no special medical plans or other welfare plans for our named executives, except that the named executives are covered by an excess personal liability policy that the Company provides to only certain of its senior executives.
Tax and Accounting Treatments of Elements of Compensation
Section 162(m) of the IRC disallows a tax deduction for the Company for individual executive compensation exceeding $1 million in any taxable year, excluding compensation that is considered to be “performance based” under the Incentive Compensation Plan approved by the stockholders of the Company.
During fiscal year 2006, the Company obtained stockholder approval for a plan (known as the Incentive Compensation Plan) under which annual fiscal year-end bonuses paid to senior executives may qualify as “performance-based compensation” that is not counted toward the $1 million limitation on deductibility of compensation. Under the Incentive Compensation Plan, the Compensation Committee at the beginning of each fiscal year establishes a performance period with respect to which awards in the form of fiscal year-end bonuses are granted under the plan, and also establishes a formula for determining the maximum award payable to a participant.
For fiscal year 2009, the Committee established the fiscal year (July 1, 2008 to June 30, 2009) as the performance period and established the maximum incentive award as 2.5 percent of net income for the performance period in the case of the CEO and any other participant who is a member of the Board, and 1.5 percent of net income for each other named executive. For fiscal year 2009, the Committee certified the amount of net income as defined under the
19
plan for the performance period and each participant’s maximum award under the plan, and based on the subjective evaluations discussed above, the Committee further determined each participant’s actual award, payable as their fiscal year-end bonus as well as the transaction bonus for certain of the named executives. The combined total bonuses actually paid were well below the maximum incentive awards established by the Committee.
As a result, the fiscal year-end bonuses and transaction bonuses paid to the executives under the Incentive Compensation Plan will not be counted toward the $1 million limitation on deductibility of compensation. Shares that vested under the previously described fiscal year 2007 SBI Program do not qualify as “performance-based compensation” and remain subject to the $1 million deductibility limitation under IRC Section 162(m).
Prior to the adoption of the Incentive Compensation Plan, the Company had adopted the Senior Officers Deferred Compensation Plan, an unfunded nonqualified deferred compensation plan under which amounts paid to senior executives subject to Section 162(m) in excess of $1 million are deferred on a mandatory basis until such time as the executive is no longer subject to the requirements of Section 162(m) or leaves the Company.
Mr. Haley, Mr. Wickes and Mr. Meehan have been required to defer a portion of their compensation and therefore are the only named executives who currently participate in the Senior Officers Deferred Compensation Plan. The plan offers a minimum of three investment options including an interest factor equal to the prime rate of interest as reported by the Company’s bank. Additional information on contributions and earnings under this plan is set forth in the Nonqualified Deferred Compensation table below.
Stock Ownership Guidelines
The Company believes that stock ownership aligns associates’ financial interest with the interests of other stockholders and the Company. Our executive ownership guidelines specify a minimum amount of Watson Wyatt stock that an associate should accumulate over ten or more years of employment with Watson Wyatt. For our named executives, the guidelines call for accumulating and holding vested shares having a value in excess of 150 percent of base salary, with such guideline prorated over the first ten years of employment with the Company. Each of our named executives had satisfied his guideline as of the end of fiscal year 2009 and owned substantially more stock than required by the guidelines.
COMPENSATION COMMITTEE REPORT
Our Committee is composed of four independent Directors, each of whom meets the independence requirements of the NYSE and NASDAQ listing standards and the rules and regulations of the SEC. The Compensation Committee operates under a written charter adopted by the Board. Our charter can be viewed on the Company’s website (www.watsonwyatt.com), in the Investor Relations section.
We have reviewed and discussed the Compensation Discussion and Analysis (CD&A) with the CEO, CFO and senior management. Based upon our review and such discussion, we recommended to the Board that the CD&A be included in this disclosure document.
THE COMPENSATION COMMITTEE:
Gilbert T. Ray (Chair)
John J. Gabarro
Brendan R. O’Neill
Linda D. Rabbitt
20
Executive Compensation
Summary Compensation Table
The following table sets forth information for fiscal years 2009, 2008 and 2007 concerning the compensation paid by the Company to (i) the Chief Executive Officer; (ii) the Chief Financial Officer, and (iii) the three other most highly compensated individuals who were serving as executive officers of the Company at the end of fiscal year 2009. These individuals are referred to as our named executives.
|
Name
and Principal |
|
Fiscal |
|
Salary |
|
Bonus |
|
Stock |
|
Change in |
|
All Other |
|
Total ($) |
|
||||||
|
|
|
|
|
|
|
|
|
|
|
|
|
|
|
|
|
||||||
|
John J. Haley |
|
2009 |
|
$ |
905,000 |
|
$ |
1,281,000 |
|
$ |
602,058 |
|
$ |
511,176 |
|
$ |
87,393 |
|
$ |
3,386,627 |
|
|
President, Chief |
|
2008 |
|
865,000 |
|
1,300,000 |
|
1,980,375 |
|
2,491,531 |
|
79,495 |
|
6,716,401 |
|
||||||
|
Executive Officer, |
|
2007 |
|
826,250 |
|
876,750 |
|
2,018,750 |
|
1,597,575 |
|
29,839 |
|
5,349,164 |
|
||||||
|
Chairman of the Board and Director |
|
|
|
|
|
|
|
|
|
|
|
|
|
|
|
||||||
|
|
|
|
|
|
|
|
|
|
|
|
|
|
|
|
|
||||||
|
Roger Millay(6) |
|
2009 |
|
481,250 |
|
558,000 |
|
0 |
|
120,607 |
|
6,900 |
|
1,166,757 |
|
||||||
|
Vice President and Chief Financial Officer |
|
|
|
|
|
|
|
|
|
|
|
|
|
|
|
||||||
|
|
|
|
|
|
|
|
|
|
|
|
|
|
|
|
|
||||||
|
Carl D. Mautz(7) |
|
2009 |
|
78,333 |
|
0 |
|
(23,924 |
) |
520 |
|
62,133 |
|
117,062 |
|
||||||
|
Former Vice President |
|
2008 |
|
467,500 |
|
330,000 |
|
539,422 |
|
262,747 |
|
24,298 |
|
1,623,967 |
|
||||||
|
and Chief Financial |
|
2007 |
|
456,250 |
|
250,000 |
|
355,938 |
|
376,949 |
|
4,950 |
|
1,444,087 |
|
||||||
|
Officer |
|
|
|
|
|
|
|
|
|
|
|
|
|
|
|
||||||
|
|
|
|
|
|
|
|
|
|
|
|
|
|
|
|
|
||||||
|
Gene H. Wickes |
|
2009 |
|
568,750 |
|
699,000 |
|
119,633 |
|
1,065 |
|
75,449 |
|
1,463,897 |
|
||||||
|
Vice President and |
|
2008 |
|
546,250 |
|
465,000 |
|
396,250 |
|
427,450 |
|
69,762 |
|
1,904,712 |
|
||||||
|
Global Director of the |
|
2007 |
|
531,250 |
|
335,000 |
|
407,734 |
|
519,927 |
|
45,847 |
|
1,839,758 |
|
||||||
|
Benefits Practice |
|
|
|
|
|
|
|
|
|
|
|
|
|
|
|
||||||
|
|
|
|
|
|
|
|
|
|
|
|
|
|
|
|
|
||||||
|
Kevin L. Meehan |
|
2009 |
|
568,750 |
|
480,000 |
|
117,154 |
|
1,527 |
|
33,339 |
|
1,200,770 |
|
||||||
|
Vice President, |
|
2008 |
|
545,000 |
|
530,000 |
|
365,703 |
|
1,071,507 |
|
30,169 |
|
2,542,379 |
|
||||||
|
Regional Manager |
|
2007 |
|
522,500 |
|
340,000 |
|
249,688 |
|
216,334 |
|
4,950 |
|
1,333,472 |
|
||||||
|
(North America) |
|
|
|
|
|
|
|
|
|
|
|
|
|
|
|
||||||
|
|
|
|
|
|
|
|
|
|
|
|
|
|
|
|
|
||||||
|
Walter Bardenwerper |
|
2009 |
|
495,000 |
|
611,000 |
|
78,121 |
|
1,263 |
|
1,800 |
|
1,187,184 |
|
||||||
|
Vice President, |
|
2008 |
|
476,250 |
|
375,000 |
|
258,223 |
|
660,089 |
|
25,389 |
|
1,794,951 |
|
||||||
|
Secretary and General |
|
2007 |
|
461,250 |
|
275,000 |
|
263,965 |
|
655,099 |
|
4,950 |
|
1,660,264 |
|
||||||
|
Counsel |
|
|
|
|
|
|
|
|
|
|
|
|
|
|
|
||||||
21
(1) Salary adjustments become effective on October 1 of each fiscal year. Effective October 1, 2008, Mr. Haley’s base salary increased from $875,000 to $915,000, Mr. Wickes’ base salary increased from $550,000 to $575,000, Mr. Meehan’s base salary increased from $550,000 to $575,000 and Mr. Bardenwerper’s base salary increased from $480,000 to $500,000. Except for Mr. Millay and Mr. Mautz, the salary amounts shown in the Summary Compensation Table for fiscal year 2009 reflect three months of salary at the rate in effect prior to October 1, 2008 and nine months of salary at the new rate effective October 1, 2008. The salary amount shown for Mr. Millay represents the amount of salary from his date of hire on August 18, 2009 based on an annual rate of $550,000. The salary amount shown for Mr. Mautz represents the amount of salary from July 1, 2008 through his retirement effective August 29, 2008 based on an annual rate of $470,000.
(2) Reflects the value of fiscal year-end bonuses earned during fiscal year 2009 and paid in September 2009 in the following amounts: Mr. Haley - $1,281,000; Mr. Millay - $408,000; Mr. Wickes - $499,000; Mr. Meehan - $480,000; and Mr. Bardenwerper - $411,000. Twenty-five percent of each such bonus was paid in the form of fully vested Company stock issued under the 2001 Deferred Stock Unit Plan for Selected Employees. The remaining seventy-five percent of each such bonus was paid in cash. The amounts shown also reflect transaction bonuses in the amount of $150,000 for Mr. Millay, $200,000 for Mr. Wickes and $200,000 for Mr. Bardenwerper. These bonuses were intended to reflect the special and extraordinary efforts of these named executives leading up to the announcement on June 29, 2009 of the pending merger with Towers, Perrin, Forster & Crosby. The transaction bonuses were paid entirely in cash in September 2009.
(3) Represents the dollar amount required to be recognized by the Company as an expense in fiscal year 2009 under Financial Accounting Standards Board Statement of Financial Accounting Standards No. 123(R), Share-Based Payment (FAS 123(R)), disregarding the effect of estimated forfeitures (of which there were none in fiscal year 2009), for awards under the Performance Share Bonus Incentive Program (SBI Program). Assumptions used in the calculation of these amounts are described in Note 9 to the Company’s financial statements for the fiscal year ending June 30, 2009.
The awards for which expense is shown in this table for fiscal year 2009 include (i) SBI Program awards described in the Grants of Plan-Based Awards in Fiscal Year 2009 table beginning on page 24 of this disclosure document and (ii) awards granted in fiscal years 2007 and 2008 for which we recognized expense in fiscal year 2009, which are described below the Stock Vested During Fiscal Year 2009 table and the Outstanding Equity Awards at 2009 Fiscal Year-End table beginning on page 25 of this disclosure document.
The decrease in stock-based compensation expense recognized in fiscal year 2009 as compared with fiscal years 2008 and 2007 is due in part to lower forecasted vesting under the fiscal year 2009, 2008 and 2007 SBI Programs than has historically resulted under earlier SBI Programs for which compensation expense was recognized in fiscal years 2008 and 2007. In addition, during fiscal year 2009 the Company lowered its forecast for projected vesting under the fiscal year 2008 SBI Program, resulting in a reversal in fiscal year 2009 of compensation expense recognized in prior periods. This reversal resulted in negative compensation expense being recognized for Mr. Mautz in fiscal year 2009 due to the true-up of previously recorded compensation expense.
(4) Reflects any aggregate increase in actuarial present values during fiscal year 2009 of each named executive’s accumulated benefits under the Watson Wyatt & Company Pension Plan for U.S. Employees and the Excess Compensation Plan of Watson Wyatt & Company. For fiscal year 2009, any increase was determined using assumptions that are the same as those used in the Company’s financial statements for the year ending June 30, 2009 except that retirement is assumed to occur at the earliest unreduced retirement age for the named executives or as of fiscal year end for named executives older than the earliest unreduced retirement age, and no pre-retirement terminations or deaths are assumed to occur.
The earliest unreduced retirement age for Messrs. Haley, Mautz and Meehan is age 60 because all of their accumulated benefits were earned under the grandfathered prior pension plan provisions as of June 30, 2008 (see plan description below for more detail). The earliest unreduced retirement age for Messrs. Millay, Wickes and Bardenwerper is age 62 based on the unreduced retirement age for benefits earned after June 30, 2008. As a result of the transition from prior pension plan provisions to post-2008 benefit provisions, the earliest unreduced retirement age for Messrs. Wickes and Bardenwerper changed from age
22
60 as of June 30, 2008 to age 62 as of June 30, 2009. This caused the actuarial present value of their accumulated pension benefits to decrease by $101,057 and $337,146, respectively, despite the additional accrued benefits payable at age 62. The actuarial present value of Mr. Meehan’s accumulated benefits decreased during the fiscal year, by $332,834, because he is already past the earliest unreduced retirement age. The actuarial present value of Mr. Mautz’s accumulated benefits decreased during the fiscal year, by $1,862,099 because he received payments totaling $1,862,777 after his retirement on August 29, 2009. These decreases are not reflected in the respective amounts reported in the Summary Compensation Table for these named executives.
The increases in the actuarial present values for Mr. Haley and Mr. Millay for fiscal year 2009 of $508,258 and $120,607, respectively, can be attributed to several factors. First, the increases are due to salary increases during the year, which raised the highest average compensation being used in the calculations, and due to the accrual of an additional year of service (subject to a 25-year service cap). Second, because Mr. Haley and Mr. Millay are younger than the earliest unreduced retirement age, the present values increased because they are one year closer to the assumed retirement date and retirement benefits are thus assumed to be one year closer to payment. Third, assumption changes made by the Company for financial reporting purposes as of June 30, 2009 lessened the increase in the present value calculations. The changes updated the post-retirement mortality table and increased the discount rate. These assumption changes lessened the increase in the present value amounts by two to three percent.
The amounts shown for fiscal year 2009 also include above-market interest on balances in the Deferred Savings Plan for U.S. Employees of Watson Wyatt & Company (the “Deferred Savings Plan”) of $2,918 for Mr. Haley, $520 for Mr. Mautz, $1,065 for Mr. Wickes, $1,527 for Mr. Meehan and $1,263 for Mr. Bardenwerper. Interest is considered above-market to the extent it exceeds 120 percent of the applicable federal long-term rate. Nonqualified deferred compensation earnings and account balances under the Deferred Savings Plan are disclosed in the Non-qualified Deferred Compensation during Fiscal Year 2009 table beginning on page 29 of this disclosure document.
(5) For fiscal year 2009, all other compensation consists of (a) Company matching contributions made to a qualified savings plan in the amount of $6,900 each for Mr. Haley, Mr. Millay, Mr. Wickes, and Mr. Meehan, $1,589 for Mr. Mautz and $1,800 for Mr. Bardenwerper; (b) Company contributions made to a non-qualified deferred compensation plan in the amount of $59,818 for Mr. Haley, $24,319 for Mr. Wickes, and $26,439 for Mr. Meehan; and (c) payment for the annual cash out of excess unused paid time off (all U.S.-based associates are subject to the same paid time off limits) in the amount of $20,675 for Mr. Haley, $60,544 for Mr. Mautz and $44,230 for Mr. Wickes.
The Company provides to its named executives no perquisites or other personal benefits having an aggregate incremental cost for any named executive in excess of $10,000, and as a result, the value of any such perquisites or other personal benefits is not included in this column.
(6) Mr. Millay joined the Company beginning August 18, 2008.
(7) Mr. Mautz retired from the Company effective August 29, 2008.
23
Grants of Plan-Based Awards in Fiscal Year 2009
The table below shows the equity awards that were made to each of the named executives during fiscal year 2009 under the Company’s Performance Share Bonus Incentive Program (SBI Program). The SBI Program is a long-term stock bonus arrangement for senior executives of the Company and its affiliates. Incentives under the SBI Program are provided through grants of deferred stock units pursuant to the Company’s 2001 Deferred Stock Unit Plan for Selected Employees. Each vested deferred stock unit represents a right to receive one share of Company stock following the end of the three-year performance period.
|
|
|
|
|
Grant |
|
Estimated Future Payouts |
|
Grant Date |
|
|||||
|
Name |
|
Grant |
|
Approval |
|
Threshold |
|
Target |
|
Maximum |
|
Awards |
|
|
|
Haley |
|
7/1/08 |
|
9/11/08 |
|
7,786 |
|
25,951 |
|
44,117 |
|
$ |
2,333,348 |
|
|
Millay |
|
7/1/08 |
|
9/11/08 |
|
1,829 |
|
6,094 |
|
10,360 |
|
547,940 |
|
|
|
Mautz |
|
N/A |
|
N/A |
|
0 |
|
0 |
|
0 |
|
0 |
|
|
|
Wickes |
|
7/1/08 |
|
9/11/08 |
|
1,530 |
|
5,097 |
|
8,665 |
|
458,292 |
|
|
|
Meehan |
|
7/1/08 |
|
9/11/08 |
|
1,530 |
|
5,097 |
|
8,665 |
|
458,292 |
|
|
|
Bardenwerper |
|
7/1/08 |
|
9/11/08 |
|
998 |
|
3,324 |
|
5,651 |
|
298,881 |
|
|
(1) Represents threshold, target and maximum number of performance-based deferred stock units to be earned (vested) under the Company’s SBI Program following the end of the three-year performance period beginning July 1, 2008 and ending June 30, 2011. Amounts actually earned are payable in shares of Company stock. Dividend equivalents are accrued during the performance period for outstanding SBI awards but are only paid out to the extent such awards are earned. See a discussion of the SBI Program in the Compensation Discussion and Analysis beginning on page 15 of this disclosure document.
For the fiscal year 2009 grants, the performance criteria selected by the Compensation Committee were Earnings Per Share Growth and Revenue Growth, as defined below, and the vesting criteria are based upon such metrics. Earnings Per Share (“E.P.S.”) Growth is defined as E.P.S. for the third year of the performance period compared to E.P.S. for the fiscal year preceding the start of the performance period, expressed as a percentage. E.P.S. is defined as fully diluted earnings per share from continuing operations. Revenue Growth is defined as the percentage change in revenue from the fiscal year prior to the performance period of the plan to the third year of the performance period, exclusive of any acquisitions during the performance period.
For the fiscal 2009 through 2011 performance period, an earn-out schedule using total growth over the three-year performance period for E.P.S. and Revenue is shown below:
|
E.P.S. Growth at or above |
|
47 |
% |
100 |
% |
135 |
% |
170 |
% |
|
|
34 |
% |
65 |
% |
100 |
% |
135 |
% |
|
|
|
27 |
% |
30 |
% |
65 |
% |
100 |
% |
|
|
|
|
|
|
20 |
% |
25 |
% |
35 |
% |
|
|
|
|
|
|
|
|
|
|
|
|
|
|
|
|
Revenue Growth |
|
||||
(2) Represents the grant date (July 1, 2008) fair value of the award at maximum, determined in accordance with FAS 123(R), based on the closing price on the last day of the fiscal year prior to the grant date of $52.89.
24
Outstanding Equity Awards at 2009 Fiscal Year-End
The following table sets forth information concerning the outstanding stock awards held at June 30, 2009 by each of the named executives. The stock awards shown represent performance shares granted under the fiscal year 2008 and fiscal year 2009 Performance Share Bonus Incentive Program (SBI Program). No shares for such fiscal years had vested as of June 30, 2009.
|
|
|
Stock Awards |
|
|||
|
Name |
|
Equity Incentive Plan Awards: Number |
|
Equity Incentive Plan Awards: Market or |
|
|
|
|
|
|
|
|
|
|
|
Haley |
|
7,904 |
(2) |
$ |
296,637 |
|
|
|
|
7,842 |
(3) |
294,310 |
|
|
|
|
|
|
|
|
|
|
|
Millay |
|
1,842 |
(3) |
69,130 |
|
|
|
|
|
|
|
|
|
|
|
Mautz |
|
1,327 |
(2) |
49,802 |
|
|
|
|
|
|
|
|
|
|
|
Wickes |
|
1,553 |
(2) |
58,284 |
|
|
|
|
|
1,541 |
(3) |
57,834 |
|
|
|
|
|
|
|
|
|
|
|
Meehan |
|
1,553 |
(2) |
58,284 |
|
|
|
|
|
1,541 |
(3) |
57,834 |
|
|
|
|
|
|
|
|
|
|
|
Bardenwerper |
|
1,017 |
(2) |
38,168 |
|
|
|
|
|
1,005 |
(3) |
37,718 |
|
|
(1) Reflects the value as calculated based on the closing price of the Company’s stock on June 30, 2009 of $37.53 per share.
(2) Represents the number of performance shares granted under the fiscal year 2008 SBI Program and credited with dividend equivalents through July 15, 2009 under the terms of the Watson Wyatt & Company Holdings 2001 Deferred Stock Unit Plan for Selected Employees, assuming vesting at threshold performance of 30 percent following completion of the three-year performance period ending June 30, 2010.
(3) Represents the number of performance shares granted under the fiscal year 2009 SBI Program and credited with dividend equivalents through July 15, 2009 under the terms of the Watson Wyatt & Company Holdings 2001 Deferred Stock Unit Plan for Selected Employees, assuming vesting at threshold performance of 30 percent following completion of the three-year performance period ending June 30, 2011. As of June 30, 2009, the Company was projecting that the minimum performance criteria would not be met and that there would be no payout under this program.
The fiscal year 2008 and fiscal year 2009 SBI Program documents state that the Committee shall accelerate the vesting of awards and provide for the immediate settlement in stock or cash in connection with a change in control, subject to the Committee’s authority to assure fair and equitable treatment of participants in the SBI Program.
Accordingly, on September 4, 2009, the Committee determined that, upon and subject to consummation of the proposed merger between Watson Wyatt Worldwide, Inc. and Towers, Perrin, Forster & Crosby to form a new, publicly listed company called Towers Watson & Co. (the “Merger”), the fiscal 2008 SBI Program awards shall not vest, with the effect that nothing will be earned or paid under those awards and the awards will be forfeited, but the fiscal 2009 SBI Program will vest at 100% of target. In reaching these determinations, the Committee assessed performance to date and projections of performance. As a result of these evaluations, the Committee concluded that it is not likely that the Company will achieve the fiscal year 2008 to 2010 minimum performance metrics. With respect to the fiscal 2009 to 2011 performance period, the Committee determined that it is appropriate to settle the
25
awards at target in order to treat participants fairly, retain key talent, and take account of the fact that the level at which performance metrics may be met at the time of the Merger will be uncertain, as the performance period would be only halfway completed as of December 31, 2009, the projected date of the Merger.
As a result, the following number of shares of Towers Watson & Co.’s Class A common stock, plus dividend equivalents that will have accrued, will be paid to the Company’s named executives for their vested fiscal 2009 SBI Program awards upon consummation of the Merger, representing vesting at 100% of target: Mr. Haley - 25,951; Mr. Millay - 6,094; Mr. Wickes - 5,097; Mr. Meehan - 5,097; and Mr. Bardenwerper - 3,324.
Stock Vested During Fiscal Year 2009
The following table sets forth information concerning stock awards that vested during fiscal year 2009 for each of the named executives. The stock awards represent performance shares issued under the Company’s fiscal year 2007 Performance Share Bonus Incentive Program (the “SBI Program”), including dividend equivalents credited to those shares, that vested following the end of the three-year performance period beginning July 1, 2006 and ending June 30, 2009.
|
|
|
Stock Awards |
|
|||
|
Name |
|
Number of |
|
Value Realized |
|
|
|
|
|
|
|
|
|
|
|
Haley |
|
49,076 |
|
$ |
1,841,822 |
|
|
|
|
|
|
|
|
|
|
Millay |
|
0 |
|
0 |
|
|
|
|
|
|
|
|
|
|
|
Mautz |
|
8,450 |
|
317,129 |
|
|
|
|
|
|
|
|
|
|
|
Wickes |
|
9,827 |
|
368,807 |
|
|
|
|
|
|
|
|
|
|
|
Meehan |
|
9,735 |
|
365,355 |
|
|
|
|
|
|
|
|
|
|
|
Bardenwerper |
|
6,408 |
|
240,492 |
|
|
(1) Represents the number of Company shares earned (vested) under the Company’s fiscal year 2007 SBI Program following the end of the three-year performance period beginning July 1, 2006 and ending June 30, 2009. For the fiscal year 2007 grants, the performance criteria selected by the Compensation Committee were Earnings Per Share Growth and Revenue Growth, as defined below, and the vesting criteria were based upon such metrics. Earnings Per Share (“E.P.S.”) Growth was defined as E.P.S. for the third year of the performance period compared to E.P.S. for the fiscal year preceding the start of the performance period, expressed as a percentage. E.P.S. was defined as fully diluted earnings per share from continuing operations. Revenue Growth was defined as the percentage change in revenue from the fiscal year prior to the performance period of the plan to the third year of the performance period, exclusive of any acquisitions during the performance period. In order for any of the deferred stock units granted for this performance period to vest, a threshold level of achievement under each performance criteria needed to be obtained. Additional deferred stock units would vest to the extent that performance was above the threshold levels.
26
An earn-out schedule using total growth over the three-year performance period for E.P.S. and Revenue is shown below:
|
E.P.S. Growth at or above |
|
30 |
% |
100 |
% |
135 |
% |
170 |
% |
|
|
22.5 |
% |
65 |
% |
100 |
% |
135 |
% |
|
|
|
15 |
% |
30 |
% |
65 |
% |
100 |
% |
|
|
|
|
|
|
15 |
% |
20 |
% |
25 |
% |
|
|
|
|
|
|
|
|
|
|
|
|
|
|
|
|
Revenue Growth |
|
||||
Following the completion of the fiscal 2007 through 2009 performance period, the Committee determined that 3-year E.P.S. Growth exceeded 30 percent and Revenue Growth exceeded 20 percent but was less than 25 percent. As a result, the Committee determined that awards for the 2007 through 2009 performance period had vested at 135 percent.
(2) Reflects the value as calculated based on the closing price of the Company’s stock on June 30, 2009 of $37.53 per share. The shares were actually distributed on September 15, 2009, based on the Company’s closing share price on the prior business day of $44.05. The actual value of stock awarded on the distribution date was $2,161,798 to Mr. Haley, of which $2,106,397 was automatically deferred in the form of shares into the Senior Officers Deferred Compensation Plan (SODCP); $372,223 to Mr. Mautz; $432,879 to Mr. Wickes, of which $52,731 was automatically deferred in the form of shares into the SODCP; $428,827 to Mr. Meehan; and $282,272 to Mr. Bardenwerper. The automatic deferrals to the SODCP occurred in order to keep deductible compensation below the $1 million deductible limit imposed by Section 162(m) of the Internal Revenue Code. For a description of the material terms of the SODCP, refer to Note 1 of the Non-qualified Deferred Compensation during Fiscal Year 2009 table beginning on page 30 of this disclosure document.
Pension Benefits at 2009 Fiscal Year-End
The Pension Benefits table below provides information as of June 30, 2009 regarding the number of years of credited service, the earliest unreduced retirement age and the present value of accumulated benefits payable at that retirement age with respect to the Watson Wyatt & Company Pension Plan for U.S. Employees (the “Pension Plan”), the Excess Benefit Plan of Watson Wyatt & Company (the “Excess Benefit Plan”) and the Excess Compensation Plan of Watson Wyatt & Company (the “Excess Compensation Plan”). None of the named executives currently has an accrued benefit under the Excess Benefit Plan, and thus the Excess Benefit Plan is not separately listed.
27
|
Name |
|
Plan Name |
|
Number of |
|
Earliest |
|
Present Value of |
|
Payments |
|
||
|
Haley |
|
Watson Wyatt & Company Pension Plan for U.S. Employees |
|
32.17 |
|
60 |
|
$ |
1,587,055 |
|
$ |
0 |
|
|
|
|
|
|
|
|
|
|
|
|
|
|
||
|
|
|
Excess Compensation Plan of Watson Wyatt & Company |
|
32.17 |
|
60 |
|
11,670,721 |
|
0 |
|
||
|
|
|
|
|
|
|
|
|
|
|
|
|
||
|
|
|
Total |
|
|
|
|
|
13,257,776 |
|
0 |
|
||
|
|
|
|
|
|
|
|
|
|
|
|
|
||
|
Millay |
|
Watson Wyatt & Company Pension Plan for U.S. Employees |
|
0.83 |
|
62 |
|
16,433 |
|
0 |
|
||
|
|
|
|
|
|
|
|
|
|
|
|
|
||
|
|
|
Excess Compensation Plan of Watson Wyatt & Company |
|
0.83 |
|
62 |
|
104,174 |
|
0 |
|
||
|
|
|
|
|
|
|
|
|
|
|
|
|
||
|
|
|
Total |
|
|
|
|
|
120,607 |
|
0 |
|
||
|
|
|
|
|
|
|
|
|
|
|
|
|
||
|
Mautz(2) |
|
Watson Wyatt & Company Pension Plan for U.S. Employees |
|
11.50 |
|
60 |
|
470,255 |
|
33,016 |
|
||
|
|
|
|
|
|
|
|
|
|
|
|
|
||
|
|
|
Excess Compensation Plan of Watson Wyatt & Company |
|
11.50 |
|
60 |
|
0 |
|
1,829,761 |
|
||
|
|
|
|
|
|
|
|
|
|
|
|
|
||
|
|
|
Total |
|
|
|
|
|
470,255 |
|
1,862,777 |
|
||
|
|
|
|
|
|
|
|
|
|
|
|
|
||
|
Wickes |
|
Watson Wyatt & Company Pension Plan for U.S. Employees |
|
12.50 |
|
62 |
|
380,506 |
|
0 |
|
||
|
|
|
|
|
|
|
|
|
|
|
|
|
||
|
|
|
Excess Compensation Plan of Watson Wyatt & Company |
|
12.50 |
|
62 |
|
1,896,647 |
|
0 |
|
||
|
|
|
|
|
|
|
|
|
|
|
|
|
||
|
|
|
Total |
|
|
|
|
|
2,277,153 |
|
0 |
|
||
|
|
|
|
|
|
|
|
|
|
|
|
|
||
|
Meehan |
|
Watson Wyatt & Company Pension Plan for U.S. Employees |
|
26.17 |
|
60 |
|
1,089,741 |
|
0 |
|
||
|
|
|
|
|
|
|
|
|
|
|
|
|
||
|
|
|
Excess Compensation Plan of Watson Wyatt & Company |
|
26.17 |
|
60 |
|
4,675,959 |
|
0 |
|
||
|
|
|
|
|
|
|
|
|
|
|
|
|
||
|
|
|
Total |
|
|
|
|
|
5,765,700 |
|
0 |
|
||
|
|
|
|
|
|
|
|
|
|
|
|
|
||
|
Bardenwerper |
|
Watson Wyatt & Company Pension Plan for U.S. Employees |
|
22.08 |
|
62 |
|
746,013 |
|
0 |
|
||
|
|
|
|
|
|
|
|
|
|
|
|
|
||
|
|
|
Excess Compensation Plan of Watson Wyatt & Company |
|
22.08 |
|
62 |
|
2,874,856 |
|
0 |
|
||
|
|
|
|
|
|
|
|
|
|
|
|
|
||
|
|
|
Total |
|
|
|
|
|
3,620,869 |
|
0 |
|
||
28
(1) The assumptions and methodology used in calculating the estimated present value shown in this column are the same as those used and disclosed in the Company’s audited financial statements (see Note 5) as of June 30, 2009, except the named executives are assumed to retire at their earliest unreduced retirement age as shown in the above chart or their current age, if later, and no pre-retirement terminations or deaths are assumed to occur. Also, no additional compensation or service is assumed beyond the June 30, 2009 calculation date. The specific relevant assumptions include using a discount rate of 7.50 percent and 6.75 percent, respectively, for the Pension Plan and the Excess Compensation Plan, and post-retirement mortality based on the mortality table described in Section 430(h)(3)(A) of the Internal Revenue Code for annuitants. In addition, for the Excess Compensation Plan benefits which are payable as a lump sum, an interest rate of 3.50 percent and the 1983 Group Annuity Mortality table (blended 50/50 for males and females) were used in the calculations.
(2) Mr. Mautz retired from the Company on August 29, 2008 and commenced receiving his benefits from the Pension Plan on September 30, 2008 in the monthly amount of $3,301.62 under the 100% joint and survivor option. He also received a lump sum cash out of his benefits from the Excess Compensation Plan in two installments of $1,026,729 and $803,031 on September 30, 2008 and March 31, 2009, respectively.
U.S. Based Pension Plans
The Pension Plan is a broad-based, tax-qualified defined benefit pension plan that provides a benefit to eligible employees of the Company. In general, all U.S. salaried and hourly employees, with the exception of temporary employees, leased employees and contract employees are eligible to participate. Pension Plan benefits are based upon years of service with the Company and the highest consecutive 60-month average of total compensation (base pay, overtime and bonus). The credited service amounts shown in the table above represent actual years of service with the Company. No additional years of credited service have been granted to the named executives under the Pension Plan.
The standard form of benefit payment under the Pension Plan is a single life annuity benefit for participants who are not married and a 100 percent joint and contingent annuity benefit for married participants. Alternatively, participants may elect a joint and contingent annuity with a continuation percentage of up to 100 percent, a certain and continuous annuity benefit with five or more years of guaranteed payments, or a combination of these, subject to the plan provisions, Retirement Committee approval and statutory limits. The payout option must be elected by the Participant before benefit payments begin.
The monthly benefit at normal retirement (age 65) under the qualified plan is equal to 1.7 percent times the participant’s average monthly compensation for the 60 consecutive months with the highest compensation plus 0.4 percent times the average monthly compensation for the 60 consecutive months with the highest compensation that exceeds the Social Security Covered Compensation, all times the number of completed years and months of continuous service up to 25 years.
For terminations after June 30, 2003, the Plan’s early retirement age is age 55 with five years of service (except as noted below for grandfathered associates). For associates who are eligible for early retirement and who retire prior to age 62, gross benefits are reduced 8 percent per year between ages 58 and 62, and 6 percent per year between ages 55 and 58. For deferred vested associates who retire prior to age 65, gross benefits are actuarially reduced from age 65. As of June 30, 2009, Messrs. Haley, Wickes, Meehan and Bardenwerper were eligible for early retirement benefits.
Associates who were employed by the Company on June 30, 2003 are grandfathered in prior pension plan provisions for five years, or until June 30, 2008. During the five-year grandfathering period, eligible associates will continue to accrue benefits under the Pension Plan provisions in effect before July 1, 2003, except that the five-year certain and continuous annuity form of payment is not grandfathered. Under these provisions, the same formula described above is used except that an associate’s average pay is determined to be the highest average 36 consecutive months of total pay. In addition, the benefit can never be less than the June 30, 2003 accrued benefit indexed by 3 percent each year.
Benefits accrued under the grandfathered formulas will be frozen on the earlier of June 30, 2008 or termination of employment, except for the formula that indexes the June 30, 2003 accrued benefit which will be frozen at termination of employment. At retirement or termination, whether before or after June 30, 2008, an associate’s accrued benefit will not be less than the frozen grandfathered benefit. If the associate terminates employment after age 50, the frozen grandfathered benefit will be reduced by 5 percent per year for commencement before age 60.
29
For termination before age 50, this benefit will be actuarially reduced from age 65. Grandfathered associates who attain age 50 with 10 years of service will be eligible for early retirement under the Plan. Messrs. Haley, Wickes, Meehan and Bardenwerper all currently qualify for the grandfathered Pension Plan provisions and are eligible for early retirement under those provisions.
The Excess Benefit and Excess Compensation Plans are designed to restore to eligible associates the reductions to their pension benefit imposed by IRC limitations. When the excess plan benefits are added to the benefit provided by the Pension Plan, eligible associates will receive a total benefit equal to the benefit that would have been provided by the Pension Plan had the limitations not existed. The form of benefit payment provided under the excess plans is a lump sum payable six months following the termination of employment for the named executives. The named executives currently have no accrued benefit under the Excess Benefit plan as the sum of their benefits under the Pension Plan and the Excess Compensation Plan does not exceed the maximum benefit limitation under IRC Section 415.
Non-qualified Deferred Compensation during Fiscal Year 2009
The following table sets forth information concerning aggregate earnings during fiscal year 2009 under the Company’s non-qualified deferred compensation plans and aggregate account balances in those plans as of June 30, 2009.
|
Name |
|
Non-Qualified
|
|
Executive
|
|
Company
|
|
Aggregate
|
|
Aggregate |
|
Aggregate |
|
|||||
|
Haley |
|
Deferred Savings |
|
$ |
0 |
|
$ |
59,818 |
(2) |
$ |
15,835 |
(3) |
$ |
0 |
|
$ |
388,541 |
(5) |
|
|
|
SODCP |
|
4,538,441 |
|
0 |
|
(3,517,626 |
)(4) |
0 |
|
8,066,440 |
(6) |
|||||
|
Mautz |
|
Deferred Savings |
|
0 |
|
0 |
|
2,230 |
(3) |
77,590 |
(7) |
2,904 |
(5) |
|||||
|
|
|
SODCP |
|
0 |
|
0 |
|
0 |
|
0 |
|
0 |
|
|||||
|
Millay |
|
Deferred Savings |
|
0 |
|
0 |
|
0 |
|
0 |
|
0 |
|
|||||
|
|
|
SODCP |
|
0 |
|
0 |
|
0 |
|
0 |
|
0 |
|
|||||
|
Wickes |
|
Deferred Savings |
|
0 |
|
24,319 |
(2) |
5,806 |
(3) |
0 |
|
145,855 |
(5) |
|||||
|
|
|
SODCP |
|
532,622 |
|
0 |
|
(266,989 |
)(4) |
0 |
|
573,397 |
(6) |
|||||
|
Meehan |
|
Deferred Savings |
|
0 |
|
26,439 |
(2) |
8,260 |
(3) |
0 |
|
196,707 |
(5) |
|||||
|
|
|
SODCP |
|
298,888 |
|
0 |
|
(100,477 |
)(4) |
0 |
|
198,411 |
(6) |
|||||
|
Bardenwerper |
|
Deferred Savings |
|
0 |
|
0 |
|
6,824 |
(3) |
0 |
|
140,411 |
(5) |
|||||
|
|
|
SODCP |
|
0 |
|
0 |
|
0 |
|
0 |
|
0 |
|
|||||
(1) The Deferred Savings Plan was established to supplement the benefits of those participants in the Watson Wyatt & Company Savings Plan for U.S. Employees whose Company matching contributions to the Savings Plan are limited by the compensation and elective deferral limitations, or the non-discrimination requirements, imposed by the Internal Revenue Code. The Deferred Savings Plan does not allow for employee contributions. Participants generally vest in their account after three years of service. All of the named executives (with the exception of Mr. Millay, who is not currently a participant in the Deferred Savings Plan) are fully vested in their account balances in the Deferred Savings Plan. Participants are eligible for payment of their vested account balance upon termination of employment or retirement.
The Senior Officers Deferred Compensation Plan (“SODCP”) is an unfunded nonqualified deferred compensation plan under which applicable employee remuneration (within the meaning of IRC Section 162(m)(4)) otherwise payable to senior executives who are subject to Section 162(m) in excess of $1 million is deferred on a mandatory basis until such time as the executive is no longer subject to the requirements of 162(m) or leaves the Company, at which time it becomes payable in a lump sum to the executive. The deferred amounts also become payable to the executive in the event of a change in control of the Company. As of June 30, 2009, Mr. Haley, Mr. Wickes and Mr. Meehan were the only participants in the SODCP. The plan offers a choice of investment options consisting of the S&P 500 Index, the Russell 2000 Index, Watson Wyatt Worldwide, Inc. common stock and a guaranteed interest factor equal to
30
the prime rate of interest as reported by the Company’s primary bank. The investment options the executive has selected may thereafter be changed in accordance with policies and procedures developed by the Committee.
(2) Represents Company contributions accrued as of June 30, 2009 and credited to each participant’s account on September 15, 2009. These amounts are reported in the “All Other Compensation” column of the Summary Compensation Table for fiscal year 2009.
(3) Represents interest earned during fiscal year 2009 on account balances in the Deferred Savings Plan. Interest under the Deferred Savings Plan is calculated using the prime rate of interest as reported by the Company’s bank, determined as of the first day of the calendar year. Of the amounts shown, a portion was determined to represent above-market interest and thus is included in the Summary Compensation Table for each named executive. The amount of such above-market interest is $2,918 for Mr. Haley, $520 for Mr. Mautz, $1,065 for Mr. Wickes, $1,527 for Mr. Meehan and $1,263 for Mr. Bardenwerper. Interest is considered above-market to the extent it exceeds 120 percent of the applicable federal long-term rate.
(4) Represents earnings during fiscal year 2009 on Mr. Haley’s, Mr. Wickes’ and Mr. Meehan’s respective account balances in the SODCP. Mr. Haley’s account balance is deemed to be invested pursuant to his election from among the available investment options and is credited with earnings on a monthly basis. Based on his elections, Mr. Haley’s account balance is currently deemed to be invested partially in the S&P 500 Index, partially in the Russell 2000 Index, and partially in Watson Wyatt Worldwide, Inc. common stock. Mr. Wickes’ and Mr. Meehan’s respective account balances are deemed to be invested entirely in Watson Wyatt Worldwide, Inc. common stock. None of the amounts shown were determined to represent above-market earnings.
(5) Other than the amounts shown as Company contributions for fiscal year 2009 and accruals attributable to above-market interest, no portion of the amounts shown has been reported in the Summary Compensation Table for fiscal year 2009 or in prior fiscal years. Of the balances reported, $51,322 for Mr. Haley, $16,738 for Mr. Mautz, $22,275 for Mr. Wickes, and $22,609 for Mr. Meehan is attributable to Company contributions reported in prior fiscal years, and $10,384 for Mr. Haley, $2,443 for Mr. Mautz, $3,712 for Mr. Wickes, $5,535 for Mr. Meehan and $2,137 for Mr. Bardenwerper is attributable to above-market interest accruals reported in prior fiscal years.
(6) Of the amount shown for Mr. Haley, $552,787 represents the portion of fiscal year end bonuses, $382,486 represents salary amounts and $7,686,458 represents the value of shares otherwise payable from the fiscal year 2005 and fiscal year 2006 SBI Programs that were deferred into the SODCP in fiscal year 2009 or prior fiscal years. Of the amount shown for Mr. Wickes and Mr. Meehan, $793,458 and $298,888, respectively, represents the value of shares otherwise payable from the fiscal year 2005 and fiscal year 2006 SBI Programs that were deferred into the SODCP in fiscal year 2009. The compensation expense relating to shares otherwise payable from the respective SBI Programs that were deferred into the SODCP were reported on the Summary Compensation Table for those years covered by the three-year performance period for each of the respective SBI Programs. The remainder of the amounts shown consists of accumulated aggregate earnings or losses.
(7) Following his retirement, Mr. Mautz received a distribution of $48,600 on October 15, 2008 and a second distribution of $28,990 on April 30, 2009.
31
Post Termination Payments and Benefits
The Company does not have employment agreements with any of the named executive officers. The Company has not entered into any change in control agreements with any of the named executive officers. The fiscal year 2008 and fiscal year 2009 SBI Program documents state that the Committee shall accelerate the vesting of awards and provide for the immediate settlement in stock or cash in connection with a change in control, subject to the Committee’s authority to assure fair and equitable treatment of participants in the SBI Program. Thus, the Compensation Committee could provide for vesting at any level allowed under the SBI Program, regardless of performance at the time against the metrics specified in the applicable SBI Program, including vesting above the threshold performance level of 30 percent as shown in the Outstanding Equity Awards at 2009 Fiscal Year-End table. However, any such action would be at the complete discretion of the Compensation Committee. See the discussion following the Outstanding Equity Awards at 2009 Fiscal Year End Table for an explanation of the Committee’s determination following the end of the 2009 fiscal year of outstanding equity awards under the fiscal year 2008 and fiscal year 2009 SBI Programs upon the closing of the proposed merger with Towers, Perrin, Forster & Crosby.
The account values payable through the Non-qualified Deferred Compensation Plans are shown in the Non-qualified Deferred Compensation During Fiscal Year 2009 table and would not change based on early retirement, death, disability or a change in control of the Company. The value of benefits payable to the named executives under the Pension Plan or the Excess Compensation Plan outlined above may increase (or decrease) in the event of the early retirement, death or disability of the named executive. Benefits do not become payable under the Pension Plan or the Excess Compensation Plan as a result of a change in control of the Company. Using the assumptions employed in the Pension Benefits Table (PBT) with the exception of using the actual Excess Compensation Plan lump sum interest rate as of June 30, 2009, the present value of the pension and disability benefit (as applicable) payable to each of the named executives as of June 30, 2009 in the event of early retirement, death or disability is shown in the following table.
|
|
|
|
|
Total Present Value in case of : |
|
|
|
||||||||
|
|
|
|
|
Early |
|
Increase / |
|
Death |
|
Increase
/ |
|
Disability |
|
Increase
/ |
|
|
Haley |
|
Pension Plan |
|
1,607,254 |
|
20,199 |
|
1,415,884 |
|
(171,171 |
) |
1,005,810 |
|
(581,245 |
) |
|
|
|
Excess Plan |
|
11,728,251 |
|
57,530 |
|
10,455,785 |
|
(1,214,936 |
) |
7,309,596 |
|
(4,361,125 |
) |
|
|
|
Disability |
|
N/A |
|
N/A |
|
N/A |
|
N/A |
|
1,616,863 |
|
1,616,863 |
|
|
|
|
Total |
|
13,335,505 |
|
77,729 |
|
11,871,669 |
|
(1,386,107 |
) |
9,932,269 |
|
(3,325,507 |
) |
|
|
|
|
|
|
|
|
|
|
|
|
|
|
|
|
|
|
Millay |
|
Pension Plan |
|
N/A |
|
N/A |
|
0 |
|
(16,433 |
) |
210,590 |
|
194,157 |
|
|
|
|
Excess Plan |
|
N/A |
|
N/A |
|
0 |
|
(104,174 |
) |
1,324,825 |
|
1,220,651 |
|
|
|
|
Disability |
|
N/A |
|
N/A |
|
N/A |
|
N/A |
|
3,116,193 |
|
3,116,193 |
|
|
|
|
Total |
|
N/A |
|
N/A |
|
0 |
|
(120,607 |
) |
4,651,608 |
|
4,531,001 |
|
|
|
|
|
|
|
|
|
|
|
|
|
|
|
|
|
|
|
Wickes |
|
Pension Plan |
|
462,804 |
|
82,298 |
|
411,862 |
|
31,356 |
|
473,121 |
|
92,615 |
|
|
|
|
Excess Plan |
|
2,264,177 |
|
367,530 |
|
2,024,263 |
|
127,616 |
|
2,341,078 |
|
444,431 |
|
|
|
|
Disability |
|
N/A |
|
N/A |
|
N/A |
|
N/A |
|
2,202,255 |
|
2,202,255 |
|
|
|
|
Total |
|
2,726,981 |
|
449,828 |
|
2,436,125 |
|
158,972 |
|
5,016,454 |
|
2,739,301 |
|
|
|
|
|
|
|
|
|
|
|
|
|
|
|
|
|
|
|
Meehan |
|
Pension Plan |
|
1,089,741 |
|
0 |
|
952,936 |
|
(136,805 |
) |
1,039,987 |
|
(49,754 |
) |
|
|
|
Excess Plan |
|
4,641,745 |
|
(34,214 |
) |
4,292,024 |
|
(383,935 |
) |
4,456,387 |
|
(219,572 |
) |
|
|
|
Disability |
|
N/A |
|
N/A |
|
N/A |
|
N/A |
|
203,042 |
|
203,042 |
|
|
|
|
Total |
|
5,731,486 |
|
(34,214 |
) |
5,244,960 |
|
(520,740 |
) |
5,699,416 |
|
(66,284 |
) |
|
|
|
|
|
|
|
|
|
|
|
|
|
|
|
|
|
|
Bardenwerper |
|
Pension Plan |
|
901,891 |
|
155,878 |
|
795,158 |
|
49,145 |
|
640,360 |
|
(105,653 |
) |
|
|
|
Excess Plan |
|
3,427,360 |
|
552,504 |
|
3,026,918 |
|
152,062 |
|
2,449,652 |
|
(425,204 |
) |
|
|
|
Disability |
|
N/A |
|
N/A |
|
N/A |
|
N/A |
|
1,752,777 |
|
1,752,777 |
|
|
|
|
Total |
|
4,329,251 |
|
708,382 |
|
3,822,076 |
|
201,207 |
|
4,842,789 |
|
1,221,920 |
|
32
(1) The increase for early retirement versus the PBT is due primarily to reflecting the immediate early retirement benefit payable for those under unreduced retirement age. The early retirement factors available to the named executives through the grandfathered pension plan provisions reflect a “subsidy” versus the benefit at unreduced retirement age. Note that these factors are generally available to all grandfathered plan participants depending on age and service conditions. An additional cause for the increase is due to using the actual lump sum interest rate for the Excess Compensation Plan as of June 30, 2009 versus the rate assumed in future years for financial accounting purposes. The Excess Compensation Plan benefit is payable as a lump sum. With the exception of Mr. Millay, all named executives are currently eligible for early retirement under the terms of the Pension Plan and the Excess Compensation Plan.
(2) In case of death, the Pension Plan and the Excess Compensation Plan provide a death benefit to the named executive’s spouse assuming the named executive retired on the date of his death, elected the 100 percent joint and contingent benefit form and died the next day. This benefit is provided if the participant is early retirement eligible at death and is available to all plan participants. The death benefit would represent a decrease in the present value of the benefit because the benefit is actuarially reduced for payment during the life of the spouse only. However, the table does show an increase versus the amounts shown in the PBT in some cases because of the application of the early retirement factors and the different lump sum interest rate as described in footnote (1) above.
(3) In case of disability, the Company provides a disability benefit equal to 66.67 percent of base salary, subject to a maximum monthly benefit of $30,000. This benefit is payable until age 65 or for at least 12 months, assuming the participant continues to meet the definition of disability. The table shows the value of the temporary disability benefit that would be payable to age 65 along with the pension benefits payable at age 65. Employees also receive service credits for pension purposes while on disability. The table shows that the present value increases or decreases for the different named executives. This is primarily a function of whether the named executive’s current salary exceeds the maximum monthly disability benefit and how close he is to reaching the 25 year pension service cap.
In addition, upon any termination of employment the named executives may be entitled to distributions under the deferred compensation plans described above and to benefits generally available to salaried employees, including distributions under the Company’s 401(k) plan, health care benefits, disability benefits and accrued vacation pay. Two of our named executives, Mr. Haley and Mr. Bardenwerper, in addition to accruing annual vacation during fiscal year 2009, have frozen vacation balances from prior years which, if unused, will be paid out to them upon termination of employment at their then current rate of hourly base salary. At June 30, 2009, the liability for frozen vacation pay was $287,365 for Mr. Haley and $50,001 for Mr. Bardenwerper. In the context of any particular separation from the Company, the Company and the executive may mutually agree on severance terms that could include additional benefits or payments.
In connection with his retirement from the Company effective August 29, 2008, Mr. Mautz commenced receiving his benefits from the Pension Plan and received a lump sum cash out of his benefits from the Excess Compensation Plan, as described in note 2 following the Pension Benefits at 2009 Fiscal Year-End Table, and received distributions from his account in the Deferred Savings Plan, as described in note 7 to the Non-qualified Deferred Compensation during Fiscal Year 2009 Table. In addition, the Committee determined that Mr. Mautz should continue to vest in his awards under the fiscal year 2007 and fiscal year 2008 SBI Programs to the same extent as other participants following the completion of each of the applicable three-year performance periods. Mr. Mautz vested in 8,450 shares under the Company’s fiscal year 2007 SBI Program following completion of the three-year performance period ending June 30, 2009, as disclosed in the Stock Vested During Fiscal Year 2009 Table. Mr. Mautz did not receive any severance benefits in connection with his retirement from the Company.
33
Director Compensation in Fiscal Year 2009
Every two years, at the direction of the Committee, Frederic Cook performs a competitive assessment of total director compensation using the same peer group as is used for conducting the competitive assessment of the compensation levels of each of the named executives. The Committee takes the competitive findings of the biennial assessment into account along with other factors in determining any recommendations it may make to the Board regarding the total compensation arrangements for our non-employee directors.
In fiscal 2009, we provided the following compensation to those of our Directors who are not employees of the Company.
|
Name |
|
Fees |
|
Stock |
|
Total |
|
|||
|
John J. Gabarro |
|
$ |
89,651 |
|
$ |
89,997 |
|
$ |
179,648 |
|
|
R. Michael McCullough |
|
110,750 |
|
91,827 |
|
202,577 |
|
|||
|
Brendan R. O’Neill |
|
83,233 |
|
90,780 |
|
174,013 |
|
|||
|
Linda D. Rabbitt |
|
48,700 |
|
139,299 |
|
187,999 |
|
|||
|
Gilbert T. Ray |
|
108,733 |
|
90,521 |
|
199,254 |
|
|||
|
John C. Wright |
|
130,600 |
|
90,503 |
|
221,103 |
|
|||
(1) As of June 30, 2009, the aggregate number of shares held by each outside Director, all of which were fully vested, was as follows: Gabarro — 15,207; McCullough — 2,500; O’Neill — 445; Rabbitt — 11,623; Ray — 10,974; and Wright — 14,373. In addition, as a result of deferral elections, Mr. McCullough held a vested right to 6,319.02 deferred stock units; Mr. O’Neill and Ms. Rabbitt each held a vested right to 4,561.62 deferred stock units; Mr. Ray held a vested right to 1,307.09 deferred stock units; and Mr. Wright held a vested right to 1,906.61 deferred stock units, payable in shares upon termination of Board service.
Pursuant to the Amended Compensation Plan for Outside Directors:
(1) outside Directors of the Company are paid a quarterly retainer of $11,250 plus $1,500 per day for board meetings;
(2) the fee for regular committee meetings is $1,000 per day for Compensation or Nominating and Governance Committee meetings and $2,000 per day for Audit Committee meetings;
(3) the compensation for telephone meetings of less than four hours duration is 50 percent of the applicable per day fee;
(4) the fee for other meetings is $1,000 per day;
(5) the Chairs of the Audit, Compensation, and Nominating and Governance Committees receive an annual retainer of $15,000, $10,000, and $5,000, respectively; and
(6) the Presiding Director receives an annual retainer of $10,000.
Outside Directors are paid in a combination of cash and the Company’s common stock, at the end of each calendar quarter (at the completed quarter-end share price) for services during the preceding quarter. Directors may elect to be paid through any combination of cash, deferral of cash under the Company’s Voluntary Deferred Compensation Plan for Non-Employee Directors, and/or shares of the Company’s common stock. In addition, outside Directors receive shares with a grant date market value of approximately $90,000 (subject to rounding) at the end of each fiscal year for services performed during the preceding fiscal year. Amounts reported in the table above reflect the FAS 123(R) grant date fair market value of the shares granted. Because the value of the shares received equals the number of shares issued multiplied by the grant date fair market value, no assumptions are relevant in determining grant date fair market value for FAS 123(R) purposes. The shares vest immediately at grant, and Directors may elect to receive the shares at the end of each fiscal year or in deferred stock units payable in shares upon termination of Board service.
34
The Company also maintains the Voluntary Deferred Compensation Plan for Non-Employee Directors to enable outside Directors who hold 5,000 or more shares of the Company’s common stock, at their election, to defer receipt of any or all of their Directors’ fees until they are no longer serving as Directors of the Company. Deferred amounts are credited with interest each month using an interest factor equivalent to the prime rate of interest as reported by the Company’s primary bank. None of the non-employee directors earned above-market interest on these deferred amounts during fiscal year 2009.
None of the current Directors who are employed by the Company is compensated separately for his or her services as a Director or as a member of any committee.
Item 12. Security Ownership of Certain Beneficial Owners and Management and Related Stockholder Matters.
The following table sets forth information known to the Company concerning the shares of Class A common stock beneficially owned, as of October 1, 2009, by (i) the Directors during the last fiscal year and nominees for Director of the Company; (ii) the executive officers named in the Summary Compensation Table herein under “Executive Compensation;” and (iii) all executive officers and Directors as a group. Except as otherwise indicated in the footnotes to the table below, the Company believes that the beneficial owners of the common stock, based on information furnished by such owners, have sole investment power and voting power with respect to such shares.
|
|
|
Number of Outstanding Shares Beneficially |
|
||
|
|
|
Number and Class |
|
Percent of Class(a) |
|
|
Name of Beneficial Owner |
|
Class A |
|
Class A |
|
|
John J. Haley(b) |
|
100,541 |
|
* |
|
|
Roger F. Millay |
|
1,876 |
|
* |
|
|
Carl D. Mautz(i) |
|
5,729 |
|
* |
|
|
Gene H. Wickes(c) |
|
65,447 |
|
* |
|
|
Walter W. Bardenwerper |
|
63,806 |
|
* |
|
|
Kevin L. Meehan(d) |
|
48,346 |
|
* |
|
|
John J. Gabarro |
|
15,207 |
|
* |
|
|
R. Michael McCullough(e) |
|
8,831.70 |
|
* |
|
|
Brendan R. O’Neill(f) |
|
5,015.75 |
|
* |
|
|
Linda D. Rabbitt(f) |
|
16,388.75 |
|
* |
|
|
Gilbert T. Ray(g) |
|
12,283.73 |
|
* |
|
|
John C. Wright(h) |
|
16,283.46 |
|
* |
|
|
|
|
|
|
|
|
|
All executive officers and Directors as a group: 20 |
|
827,313.39 |
|
1.9 |
% |
35
(a) Beneficial ownership of 1 percent or less of all of the outstanding common stock is indicated with an asterisk (*).
(b) Ownership includes 14,252 shares that were deferred but are treated as beneficially owned and does not include 213,886.69 deferred stock units.
(c) Ownership does not include 16,506.52 deferred stock units.
(d) Ownership does not include 5,297.05 deferred stock units.
(e) Ownership includes 6,319.02 shares that were deferred but are treated as beneficially owned.
(f) Ownership includes 4,561.62 shares that were deferred but are treated as beneficially owned.
(g) Ownership includes 1,307.09 shares that were deferred but are treated as beneficially owned.
(h) Ownership includes 1,906.61 shares that were deferred but are treated as beneficially owned.
(i) Mr. Mautz retired from Watson Wyatt effective August 29, 2008.
Security Ownership Of Certain Beneficial Owners
The following table sets forth information known to the Company concerning the shares of Class A common stock beneficially owned, as of June 30, 2009 by entities that have reported beneficial ownership of greater than five percent.
|
|
|
Number of Outstanding Shares |
|
||
|
|
|
Owned as of June 30, 2009 |
|
||
|
Name of
Beneficial |
|
Number and Class |
|
Percent |
|
|
|
|
|
|
|
|
|
|
|
|
|
|
|
|
|
|
|
|
|
|
|
|
|
|
|
Class A |
|
|
|
|
|
|
Class A |
|
(Options) |
|
Class A |
|
|
Marathon Asset Management LLP |
|
2,167,452 |
(b) |
0 |
|
5.08 |
|
|
Barclays Global Investors UK Holdings Ltd |
|
3,045,159 |
(c) |
0 |
|
7.14 |
|
(a) Pursuant to current regulations of the SEC, securities must be listed as beneficially owned by a person who directly or indirectly has or shares the power to vote (“voting power”) or the power to dispose of (“dispositive power”) the securities, whether or not the person has any economic interest in the securities. In addition, a person is deemed a beneficial owner if he has the right to acquire beneficial ownership within 60 days, whether upon exercise of a stock option or warrant, conversion of a convertible security or otherwise. The information contained in this table has been included solely in reliance upon and without independent investigation of, SEC filings including the disclosures contained in the schedules and forms referenced in the footnotes below.
(b) As reported by Marathon Asset Management LLP (“Marathon”) in its report on Form 13F filed with the SEC for the quarter ended June 30, 2009, Marathon has shared investment discretion with respect to all of such shares and discloses that it shares voting authority over 1,567,597 shares and no voting authority over 599,855 shares.
(c) As reported by Barclays Global Investors UK Holdings Ltd (“Barclays”) in its report on Form 13F filed with the SEC for the quarter ended March 31, 2009, Barclays disclosed the following: (i) Barclays Global Investors Ltd had defined investment discretion with respect to 34,885 shares and sole voting authority with respect to 3,065 shares and no voting authority with respect to 31,820 shares; (ii) Barclays Global Investors N.A. had defined investment discretion with respect to 1,649,344 shares and sole voting authority with respect to 1,396,617 shares and no voting authority with respect to 252,727 shares; (iii) Barclays Global Fund Advisors had defined investment discretion with respect to 1,222,908 shares and sole voting authority with respect to 1,059,626 shares and no voting authority with respect to 274,282 shares; (iv) Barclay’s Global Investors Australia Ltd had defined investment discretion with respect to 10,440 shares
36
and sole voting authority with respect to 10,440 shares; (v) Barclay’s Global Investors Canada Ltd had defined investment discretion with respect to 3,147 shares and sole voting authority with respect to 3,147 shares; and (vi) Barclay’s Global Investors Japan Ltd had defined investment discretion with respect to 13,445 shares and sole voting authority with respect to 13,445 shares.
Item 13. Certain Relationships and Related Transactions, and Director Independence.
Review, Approval or Ratification of Transactions with Related Persons
Our Related Party Transactions Policy (the “Policy”) is designed to avoid entering into transactions with directors, executive officers, immediate family members and certain other persons with specified relationships to the Company (a “Related Person”) except where clearly consistent with the interests of the Company and appropriately vetted and approved. This Policy is set forth in writing and administered by the Audit Committee and applies to any transaction or relationship or series of similar transactions arrangements or relationships with a Related Person. Under the Policy the Chief Financial Officer (“CFO”) shall seek approval of the Audit Committee for any proposed transaction with a Related Person of which he is informed or becomes aware. If the CFO becomes aware of an existing transaction with a Related Person which has not been approved in advance under the Policy, the matter will be referred to the Audit Committee. The Audit Committee will evaluate any options available, including ratification or take other appropriate action for existing transactions that were not approved initially by the Audit Committee. The Audit Committee will review the proposed transaction for approval, ratification or other appropriate action. In making its determination, the Audit Committee considers all relevant factors including (i) the extent of the Related Person’s interest in the Related Person Transaction, (ii) if applicable, the availability of other sources of comparable products or services, (iii) whether the terms of the Related Person Transaction are no less favorable than terms generally available in unaffiliated transactions under like circumstances, (iv) benefit to the Company, and (v) the aggregate value of the Related Person Transaction. During Fiscal Year 2009 there were no transactions subject to this policy by Related Persons.
Director Independence
The Board is composed of a majority of Directors who qualify as independent Directors pursuant to the corporate governance standards for companies listed on the NYSE and NASDAQ. The Board committee structure includes an Audit Committee, Compensation Committee, Nominating and Governance Committee and a Risk Management Committee, the first three committees consisting entirely of independent Directors.
In determining independence, each year the Board affirmatively determines whether Directors have any material relationship with the Company. When assessing the materiality of a Director’s relationship with the Company, the board considers all relevant facts and circumstances, not merely from the Director’s standpoint, but from that of the persons or organizations with which the Director has an affiliation, and the frequency or regularity of the services, if any, provided to or by such persons or organizations, whether the services are being carried out at arm’s length in the ordinary course of business and whether the services are being provided substantially on the same terms to the Company as those prevailing at the time from unrelated parties for comparable transactions. Material relationships can include commercial, banking, industrial, consulting, legal, accounting, charitable and familial relationships. A Director will not be considered independent if:
(1) the Director is, or in the past three years has been, an employee of the Company, or an immediate family member of the Director is, or in the past three years has been, an executive officer of the Company;
(2) the Director, or a member of the Director’s immediate family, is receiving or has in the past three years received direct compensation from the Company in excess of $100,000 per year, other than compensation for Board service, compensation received by the Director’s immediate family member for service as a non-executive employee of the Company, and pension or other forms of deferred compensation for prior service with the Company;
(3) the Director, or a member of the Director’s immediate family, is or in the past three years has been an executive officer of another company where any of the Company’s present executives at the same time serves or served on the Compensation Committee;
37
(4) the Director or an immediate family member is a current partner of the Company’s internal or outside auditor; the Director is a current employee of the internal or outside auditor; the Director has an immediate family member who is a current employee of the internal or outside auditor and who participates in the auditor’s audit, assurance or tax compliance practice; or the Director or an immediate family member was within the past three years a partner or employee of the internal or outside auditor and personally worked on the Company’s audit; or
(5) the Director is an executive officer or employee, or a member of the Director’s immediate family is an executive officer of another company that has made payments to or received payments from the Company for property or services in an amount that, in any of the past three fiscal years, exceeded the greater of $1 million or 2 percent of the other company’s consolidated gross revenues.
For these purposes, an “immediate family” member includes a Director’s spouse, parents, children, siblings, mother and father-in-law, sons and daughters-in-law, brothers and sisters-in-law, and anyone (other than a domestic employee) who shares the Director’s home.
Applying these standards, the Board has determined that the following Directors are independent: John J. Gabarro, R. Michael McCullough, Brendan R. O’Neill, Linda D. Rabbitt, Gilbert T. Ray, and John C. Wright. In making these determinations, the board determined that none of the independent Directors, their family members or organizations with which the Directors are affiliated have any material direct or indirect relationship with the Company.
Item 14. Principal Accounting Fees and Services.
Fees Paid to the Independent Registered Public Accounting Firm
The Audit Committee has responsibility for the appointment, compensation and oversight of the work of the independent registered public accounting firm. Deloitte & Touche LLP (“Deloitte”) is the Company’s independent registered public accounting firm and audited the Company’s financial statements for fiscal years 2008 and 2009.
As part of its oversight responsibility, the Audit Committee must pre-approve all permissible services to be performed by the independent registered public accounting firm. The Audit Committee has established policies and procedures for the pre-approval of audit and non-audit services to be performed by the independent registered public accounting firm.
Under the policy, the Committee must give prior approval for any amount or specific type of service within four categories: (i) audit, (ii) audit-related, (iii) tax services or, to the extent permitted by law, (iv) other services that the independent registered public accounting firm provides. Prior to the annual engagement, the Audit Committee may grant pre-approval for specific independent registered public accounting firm services within these four categories at maximum pre-approved fee levels; however, the Audit Committee’s policy is generally not to engage the independent registered public accounting firm for any non-audit related services, including tax planning or tax return preparation. If circumstances arise that would require the Company to engage the independent registered public accounting firm for additional services not contemplated in the original pre-approval, then the engagement for such services would require separate pre-approval by the Audit Committee. The Chair of the Audit Committee is authorized to approve a request for pre-approval provided the additional service is presented to the Audit Committee for approval at its next scheduled meeting.
The following table presents fees for professional audit services rendered by Deloitte for the audit of the Company’s annual financial statements for the years ended June 30, 2008 and 2009 and fees billed by Deloitte for other services rendered during those respective periods.
38
|
|
|
2008 |
|
2009 |
|
||
|
|
|
Deloitte & |
|
Deloitte & |
|
||
|
Fee Category |
|
LLP |
|
LLP |
|
||
|
Audit Fees (1) |
|
$ |
3,780,581 |
|
$ |
3,621,500 |
|
|
Audit-Related Fees (2) |
|
374,406 |
|
132,000 |
|
||
|
Tax Fees (3) |
|
42,683 |
|
13,041 |
|
||
|
Subtotal |
|
4,197,670 |
|
3,766,541 |
|
||
|
All Other Fees (4) |
|
2,000 |
|
2,000 |
|
||
|
Total Fees |
|
$ |
4,199,670 |
|
$ |
3,768,541 |
|
(1) Audit Fees – consists of fees billed for professional services performed by Deloitte for the audit of the Company’s annual financial statements, review and audit of internal controls to ascertain compliance with the Sarbanes-Oxley Act, review of financial statements included in the Company’s quarterly and annual filings, and services that are normally provided in connection with statutory and regulatory filings or engagements.
(2) Audit-Related Fees – includes fees for benefit plan audits and related services performed by Deloitte that are reasonably related to the performance of the audit or review of the Company’s financial statements and are not reported under “Audit Fees.”
(3) Tax Fees – includes fees of Deloitte for any professional services related to tax compliance, tax advice and/or tax planning primarily for overseas matters.
(4) All Other Fees – represents fees for an annual license fee for access to Deloitte’s online database of financial reporting and accounting literature.
39
SIGNATURES
Pursuant to the requirements of Section 13 or 15(d) of the Securities Exchange Act of 1934, the registrant has duly caused this report to be signed on its behalf by the undersigned, thereunto duly authorized.
|
|
WATSON WYATT WORLDWIDE, INC. |
|
|
|
(Registrant) |
|
|
|
|
|
|
Date: October 20, 2009 |
By: |
/s/ John J. Haley |
|
|
|
John J. Haley |
|
|
|
President and Chief Executive Officer |
Pursuant to the requirements of the Securities Exchange Act of 1934, this report has been signed below by the following persons on behalf of the registrant and in the capacities and on the dates indicated.
|
Signature |
|
Title |
|
Date |
|
|
|
|
|
|
|
/s/ John J. Haley |
|
President, Chief Executive Officer and Director |
|
October 20, 2009 |
|
John J. Haley |
|
|
|
|
|
|
|
|
|
|
|
/s/ Roger F. Millay |
|
Vice President and Chief Financial Officer |
|
October 20, 2009 |
|
Roger F. Millay |
|
|
|
|
|
|
|
|
|
|
|
/s/ Peter L. Childs |
|
Controller |
|
October 20, 2009 |
|
Peter L. Childs |
|
|
|
|
|
|
|
|
|
|
|
/s/ John J. Gabarro |
|
Director |
|
October 20, 2009 |
|
John J. Gabarro |
|
|
|
|
|
|
|
|
|
|
|
/s/ R. Michael McCullough |
|
Director |
|
October 20, 2009 |
|
R. Michael McCullough |
|
|
|
|
|
|
|
|
|
|
|
/s/ Brendan O’Neill |
|
Director |
|
October 20, 2009 |
|
Brendan O’Neill |
|
|
|
|
|
|
|
|
|
|
|
/s/ Linda D. Rabbitt |
|
Director |
|
October 20, 2009 |
|
Linda D. Rabbitt |
|
|
|
|
|
|
|
|
|
|
|
/s/ Gilbert T. Ray |
|
Director |
|
October 20, 2009 |
|
Gilbert T. Ray |
|
|
|
|
|
|
|
|
|
|
|
/s/ John C. Wright |
|
Director |
|
October 20, 2009 |
|
John C. Wright |
|
|
|
|
40
EXHIBITS.
In reviewing the agreements included or incorporated by reference as exhibits to this Annual Report on Form 10-K/A, it is important to note that they are included to provide investors with information regarding their terms, and are not intended to provide any other factual or disclosure information about Watson Wyatt or the other parties to the agreements. The agreements contain representations and warranties made by each of the parties to the applicable agreement. These representations and warranties have been made solely for the benefit of the other parties to the applicable agreement, and should not be treated as categorical statements of fact, but rather as a way of allocating risk between the parties; have in some cases been qualified by disclosures that were made to the other party in connection with the negotiation of the applicable agreement, which disclosures are not necessarily reflected in the agreement; may apply standards of materiality in a way that is different from what may be material to investors; and were made only as of the date of the applicable agreement or such other date or dates as may be specified in the agreement and are subject to more recent developments.
Accordingly, these representations and warranties may not describe the actual state of affairs as of the date they were made or at any other time. Additional information about Watson Wyatt may be found elsewhere in this Annual Report on Form 10-K/A and our other public filings, which are available without charge through the SEC’s website at http://www.sec.gov.
|
21 |
Subsidiaries of Watson Wyatt Worldwide, Inc. |
|
31.1 |
Certification of Chief Executive Officer Pursuant to Securities Exchange Act Rules 13a-14 and 15d-14, as adopted pursuant to Section 302 of the Sarbanes-Oxley Act of 2002 |
|
31.2 |
Certification of Chief Financial Officer Pursuant to Securities Exchange Act Rules 13a-14 and 15d-14, as adopted pursuant to Section 302 of the Sarbanes-Oxley Act of 2002 |
|
32 |
Certification of Chief Executive Officer and Chief Financial Officer Pursuant to Title 18, U.S.C. Section 1350, adopted pursuant to Section 906 of the Sarbanes-Oxley Act of 2002 |
41