Attached files
| file | filename |
|---|---|
| 8-K - 8-K - RETAIL PROPERTIES OF AMERICA, INC. | a09-30387_28k.htm |
| EX-99.1 - EX-99.1 - RETAIL PROPERTIES OF AMERICA, INC. | a09-30387_2ex99d1.htm |
Exhibit 99.2
|
|
Annual Meeting of Stockholders October 13, 2009 |
|
|
Corporate Overview & Strategy |
|
|
Corporate Overview As of June 30, 2009 4,144,626 Sq Ft Maine Minnesota Montana North Dakota Washington Colorado Conn Delaware Idaho Illinois Indiana Iowa Md Mass Michigan Nebraska Nevada N.H. New Jersey New York Ohio Oregon Pennsylvania R.I. South Dakota Utah Vt. Wisconsin Wyoming 4,439,705 Sq Ft 2,297,591 Sq Ft Alabama Arizona Arkansas California Georgia Kansas Kentucky Louisiana Mississippi Missouri New Mexico North Carolina Oklahoma South Carolina Tennessee Texas Virginia West Virginia 9,077,634 Sq Ft 1,929,443 Sq Ft 1,638,351 Sq Ft Florida More than 5 MSF +1-5 MSF Less than 1 MSF Total GLA by State Inland Western Retail Real Estate Trust, Inc. is a self-managed real estate investment trust that acquires and manages a diversified portfolio of real estate, primarily multi-tenant shopping centers, across the United States. As of June 30, 2009, our portfolio under management totaled in excess of 49 million square feet, consisting of 301 consolidated operating properties. We also have interest in 12 unconsolidated operating properties and 17 properties in 7 development joint ventures. 3 |

|
|
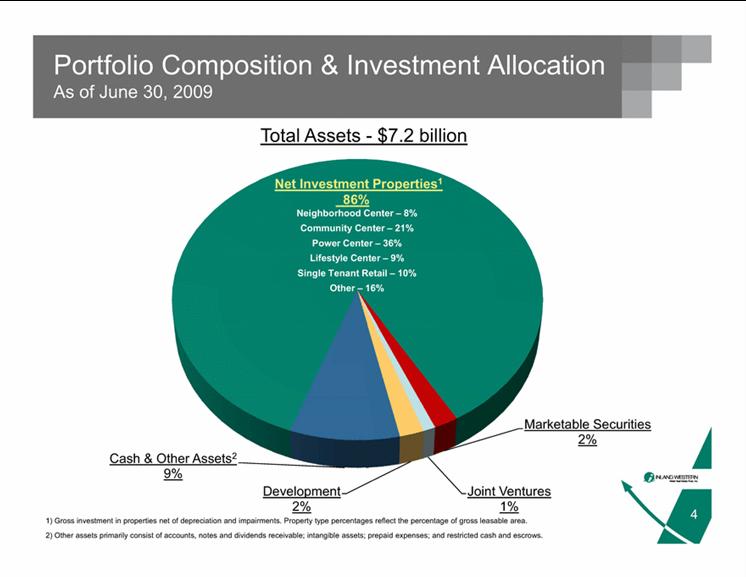
Portfolio Composition & Investment Allocation As of June 30, 2009 Total Assets - $7.2 billion Net Investment Properties1 86% Community Center – 21% Neighborhood Center – 8% Power Center – 36% Lifestyle Center – 9% Single Tenant Retail – 10% Other – 16% Marketable Securities 2% Cash & Other Assets2 9% Joint Ventures 1% Development 2% 1) Gross investment in properties net of depreciation and impairments. Property type percentages reflect the percentage of gross leasable area. 2) Other assets primarily consist of accounts, notes and dividends receivable; intangible assets; prepaid expenses; and restricted cash and escrows. 4 |
|
|
Business Strategy From inception, our strategy has been to acquire and manage a portfolio comprised of strategically located assets with tenants who are predominantly credit-rated, value-oriented, necessity-based retailers. This segment has historically demonstrated limited volatility during economic downturns. Diversification by geography, by retail property type and by tenant to mitigate risk and exposure to any one segment. Conservative balance sheet with minimal corporate debt. Majority of debt comprised of individual mortgage loans; coupled with a $14 million average loan size, this broadens our lending sources. Disciplined asset management incorporates regular review of portfolio resulting in proactive identification of issues and opportunities. 5 |
|
|
Recessionary Impact The Dow Jones Industrial Average fell 51% during 2008; a broadly used index for traded REITs, the RMZ, fell 41.5% during the same time period.1 Over 2 million Americans lost their jobs during 2008, with the unemployment rate rising from 4.9% in January to 7.2% in December. This rate has continued to rise during 2009, with a 9.8% unemployment rate recorded for September.2 Globally, there were $504 billion in commercial property sales in 2008, which represented a 60% decline over 2007 sales. During 2008, there was a 76% decline in the U.S. commercial property sales volume. In the first half of 2009, U.S. commercial real estate sales volume continued to decline, totaling $16 billion, down 80% from the first half of 2008.3 Banks in 2008, faced with mounting credit losses, tightened terms and standards on loans to businesses and households. Commercial lending via commercial mortgage-backed securities (CMBS) has come to a standstill decreasing from $230 billion issued in 2007 to $12 billion issued in 2008. There was no new CMBS issuance in the first six months of 2009. 4 The personal savings rate as a percentage of personal income in the U.S. rose during 2008 from 1.3% in January to 3.6% in December. In 2009, the savings rate continued to rise to a 14-year high of 6% in May before falling to 4.2% in July.5 1) Source: Yahoo Finance 2) Source: Bureau of Labor Statistics 3) Source: Bloomberg 4) Source: www.miacanalytics.com 5) Source: Bureau of Economic Analysis 6 |
|
|
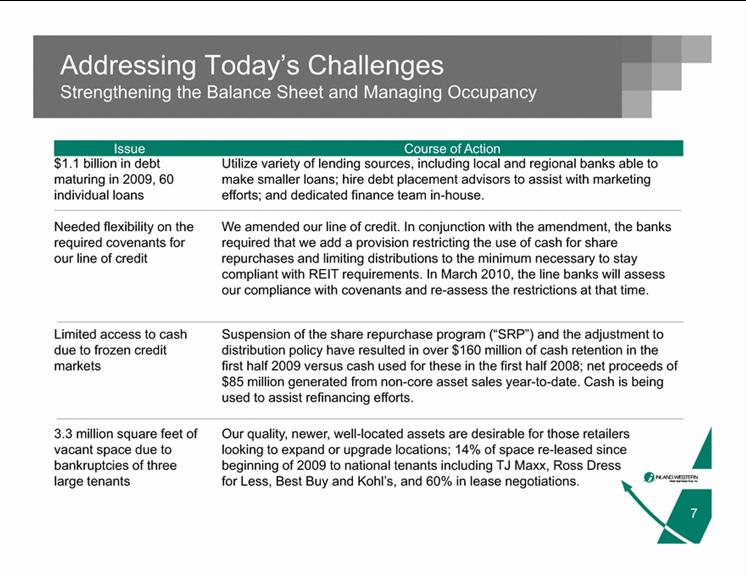
Addressing Today’s Challenges Strengthening the Balance Sheet and Managing Occupancy Issue Course of Action $1.1 billion in debt maturing Utilize variety of lending sources, including local and regional banks able to make smaller loans; hire debt placement advisors to assist with marketing in 2009, 60 individual loans efforts; and dedicated finance team in-house. Needed flexibility on the required covenants for We amended our line of credit. In conjunction with the amendment, the banks required that we add a provision restricting the use of cash for share our line of credit repurchases and limiting distributions to the minimum necessary to stay compliant with REIT requirements. In March 2010, the line banks will assess our compliance with covenants and re-assess the restrictions at that time. Limited access to cash due to frozen credit markets Suspension of the share repurchase program (“SRP”) and the adjustment to distribution policy have resulted in over $160 million of cash retention in the first half 2009 versus cash used for these in the first half 2008; net proceeds of $85 million generated from non-core asset sales year-to-date. Cash is being used to assist refinancing efforts. 3.3 million square feet of vacant space due to bankruptcies of three Our quality, newer, well-located assets are desirable for those retailers looking to expand or upgrade locations; 14% of space re-leased since beginning of 2009 to national tenants including TJ Maxx, Ross Dress 7 large tenants for Less, Best Buy and Kohl’s, and 60% in lease negotiations. |
|
|
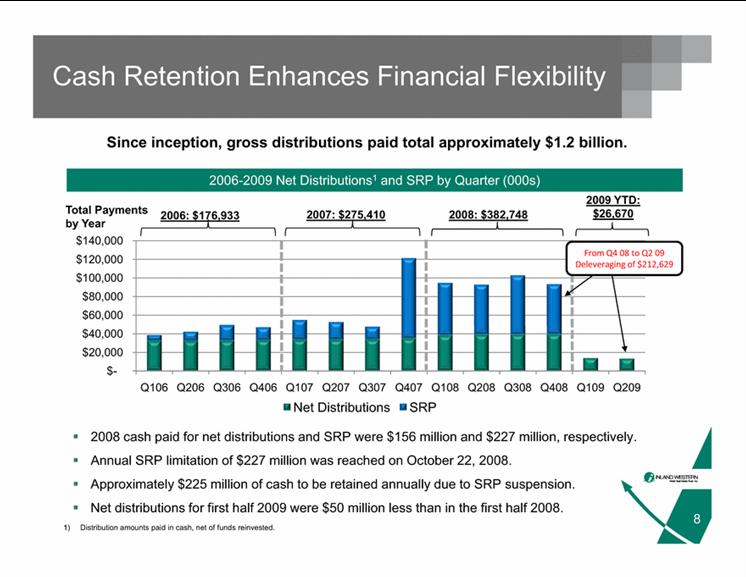
Cash Retention Enhances Financial Flexibility 2009 Distributions1 and Quarter (000s) Since inception, gross distributions paid total approximately $1.2 billion. 2006-Net SRP by 2006: $176,933 2009 YTD: $26,670 Total Payments by Year 2007: $275,410 2008: $382,748 $140,000 From Q4 08 Q2 $60,000 $80,000 $100,000 $120,000 to 09 Deleveraging of $212,629 $- $20,000 $40,000 Q106 Q206 Q306 Q406 Q107 Q207 Q307 Q407 Q108 Q208 Q308 Q408 Q109 Q209 2008 cash paid for net distributions and SRP were $156 million and $227 million, respectively. Annual SRP limitation of $227 million was reached on October 22, 2008. Net Distributions SRP 8 Approximately $225 million of cash to be retained annually due to SRP suspension. Net distributions for first half 2009 were $50 million less than in the first half 2008. 1) Distribution amounts paid in cash, net of funds reinvested. |
|
|
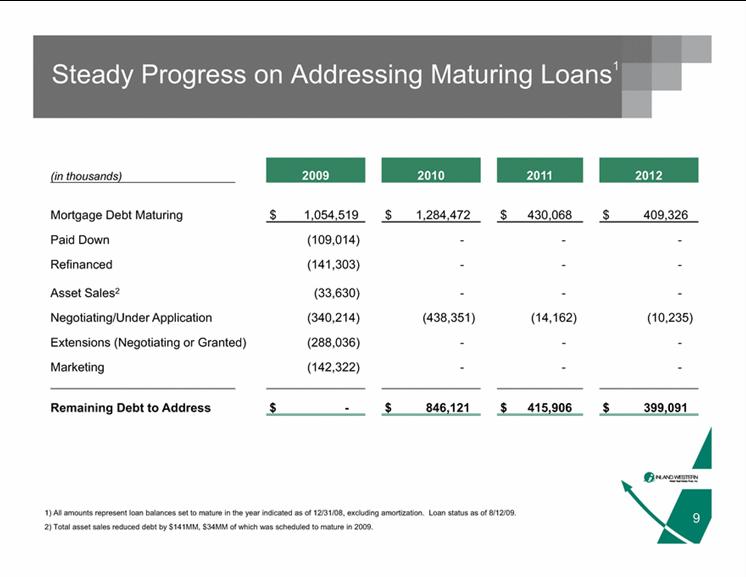
Steady Progress on Addressing Maturing Loans1 (in thousands) 2009 2010 2011 2012 Mortgage Debt Maturing $ 1,054,519 $ 1,284,472 $ 430,068 $ 409,326 Paid Down (109,014) - - - Refinanced (141,303) - - - Asset Sales2 (33,630) - - - Negotiating/Under Application (340,214) (438,351) (14,162) (10,235) Extensions (Negotiating or Granted) (288,036) - - - Marketing (142,322) - - - Remaining Debt to Address $ - $ 846,121 $ 415,906 $ 399,091 9 1) All amounts represent loan balances set to mature in the year indicated as of 12/31/08, excluding amortization. Loan status as of 8/12/09. 2) Total asset sales reduced debt by $141MM, $34MM of which was scheduled to mature in 2009. |
|
|
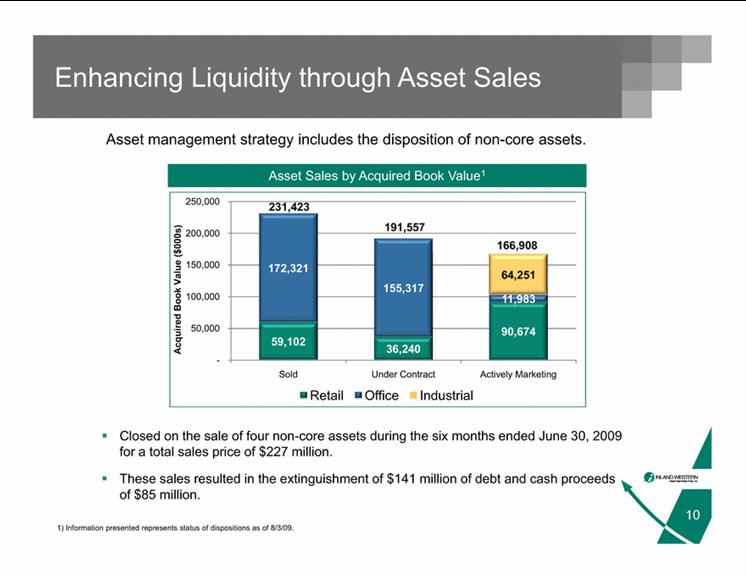
Enhancing Liquidity through Asset Sales Asset management strategy includes the disposition of non-core assets. Asset Sales by Acquired Book Value1 200,000 250,000 ($000s) 231,423 191,557 166,908 172,321 155,317 11,983 64,251 100,000 150,000 Book Value 59,102 36,240 90,674 - 50,000 Sold Under Contract Actively Marketing Acquired Retail Office Industrial Closed on the sale of four non-core assets during the six months ended June 30, 2009 for a total sales price of $227 million. 10 1) Information presented represents status of dispositions as of 8/3/09. These sales resulted in the extinguishment of $141 million of debt and cash proceeds of $85 million. |
|
|
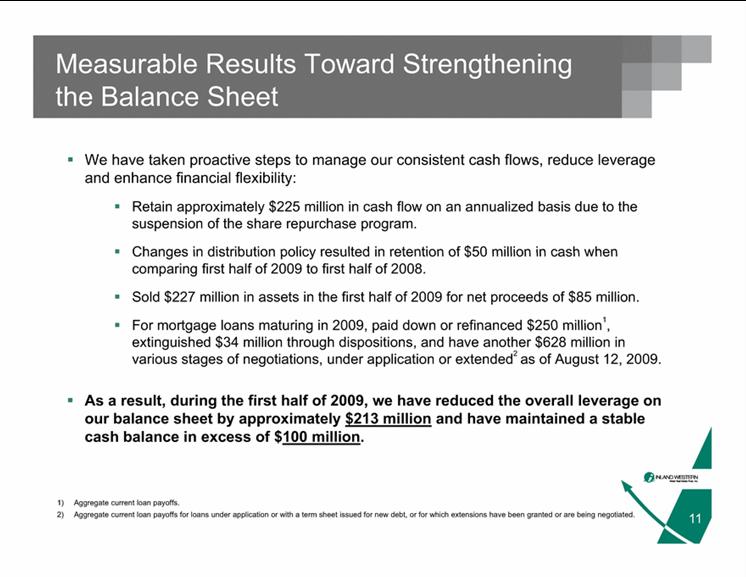
Measurable Results Toward Strengthening the Balance Sheet We have taken proactive steps to manage our consistent cash flows, reduce leverage and enhance financial flexibility: Retain approximately $225 million in cash flow on an annualized basis due to the suspension of the share repurchase program. Changes in distribution policy resulted in retention of $50 million in cash when comparing first half of 2009 to first half of 2008. Sold $227 million in assets in the first half of 2009 for net proceeds of $85 million. For mortgage loans maturing in 2009, paid down or refinanced $250 million 1, extinguished $34 million through dispositions, and have another $628 million in various stages of negotiations, under application or extended2 as of August 12, 2009. the first half of 2009 have leverage on As a result, during we reduced the overall our balance sheet by approximately $213 million and have maintained a stable cash balance in excess of $100 million. 11 1) Aggregate current loan payoffs. 2) Aggregate current loan payoffs for loans under application or with a term sheet issued for new debt, or for which extensions have been granted or are being negotiated. |
|
|
Financial Report |
|
|
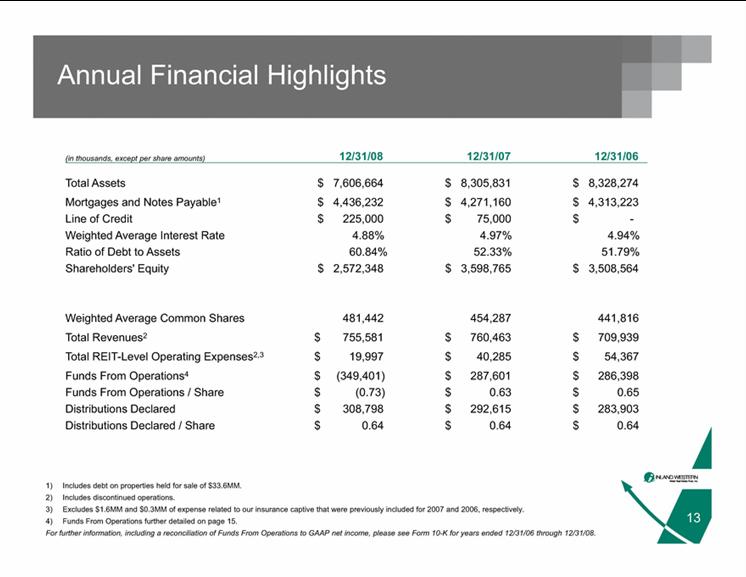
Annual Financial Highlights (in thousands, except per share amounts) 12/31/08 12/31/07 12/31/06 $ Total Assets 7,606,664 $8,305,831 $8,328,274 Mortgages and Notes Payable1 $ 4,436,232 $ 4,271,160 $ 4,313,223 Line of Credit $ 225,000 $ 75,000 $ - Weighted Average Interest Rate 4.88% 4.97% 4.94% Ratio of Debt to Assets 60.84% 52.33% 51.79% Shareholders' Equity $ 2,572,348 $ 3,598,765 $ 3,508,564 Weighted Average Common Shares 481,442 454,287 441,816 Total Revenues2 $ 755,581 $ 760,463 $ 709,939 Total REIT-Level Operating Expenses2,3 $ 19,997 $ 40,285 $ 54,367 Funds From Operations4 $ (349,401) $ 287,601 $ 286,398 Funds From Operations / Share $ (0.73) $ 0.63 $ 0.65 Distributions Declared $ 308,798 $ 292,615 $ 283,903 Distributions Declared / Share $ 0.64 $ 0.64 $ 0.64 1) Includes debt on properties held for sale of $33.6MM. 2) Includes discontinued operations. 3) Excludes $1.6MM and $0.3MM of expense related to our insurance captive that were previously included for 2007 and 2006, respectively. 4) Funds From Operations further detailed on page 15. For further information, including a reconciliation of Funds From Operations to GAAP net income, please see Form 10-K for years ended 12/31/06 through 12/31/08. 13 |
|
|
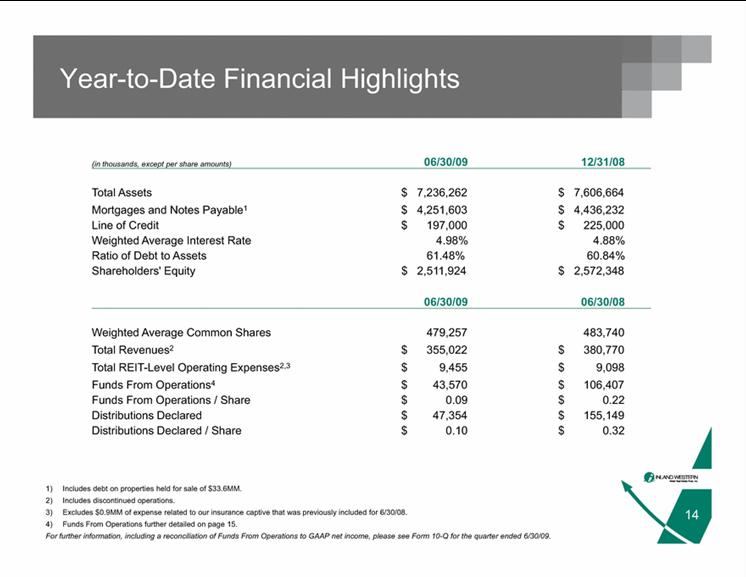
Year-to-Date Financial Highlights (in thousands, except per share amounts) 06/30/09 12/31/08 Total Assets $ 7,236,262 $ 7,606,664 Mortgages and Notes Payable1 $ 4,251,603 $ 4,436,232 Line of Credit $ 197,000 $ 225,000 Weighted Average Interest Rate 4.98% 4.88% Ratio of Debt to Assets 61.48% 60.84% Shareholders' Equity $ 2,511,924 $ 2,572,348 06/30/09 06/30/08 Weighted Average Common Shares 479,257 483,740 Total Revenues2 $ 355,022 $ 380,770 Total REIT-Level Operating Expenses2,3 $ 9,455 $ 9,098 Funds From Operations4 $ 43,570 $ 106,407 Funds From Operations / Share $0.09 $0.22 Distributions Declared $ 47,354 $ 155,149 Distributions Declared / Share $ 0.10 $ 0.32 14 1) Includes debt on properties held for sale of $33.6MM. 2) Includes discontinued operations. 3) Excludes $0.9MM of expense related to our insurance captive that was previously included for 6/30/08. 4) Funds From Operations further detailed on page 15. For further information, including a reconciliation of Funds From Operations to GAAP net income, please see Form 10-Q for the quarter ended 6/30/09. |
|
|
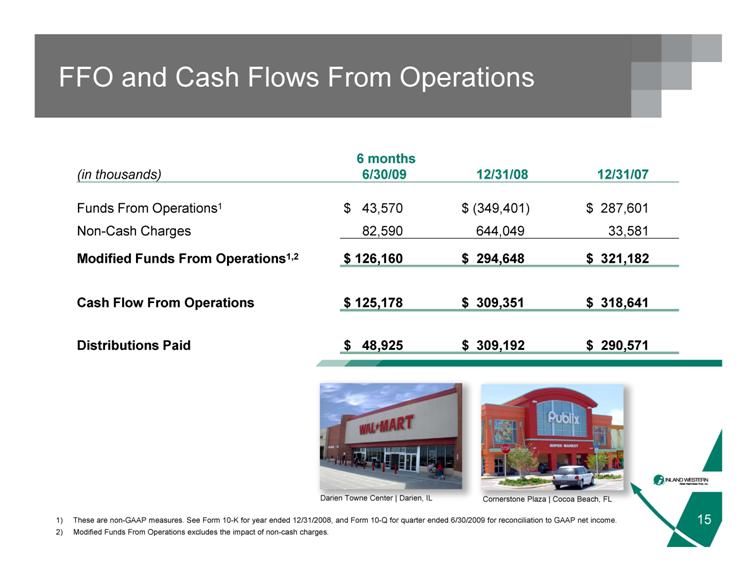
FFO and Cash Flows From Operations (in thousands) 6 months 6/30/09 12/31/08 12/31/07 Funds From Operations1 $ 43,570 $ (349,401) $ 287,601 Non-Cash Charges 82,590 644,049 33,581 Modified Funds From Operations1,2 $126,160 $294,648 $321,182 Cash Flow From Operations $ 125,178 $ 309,351 $ 318,641 Distributions Paid $ 48,925 $ 309,192 $ 290,571 15 1) These are non-GAAP measures. See Form 10-K for year ended 12/31/2008, and Form 10-Q for quarter ended 6/30/2009 for reconciliation to GAAP net income. 2) Modified Funds From Operations excludes the impact of non-cash charges. Darien Towne Center | Darien, IL Cornerstone Plaza | Cocoa Beach, FL |
|
|
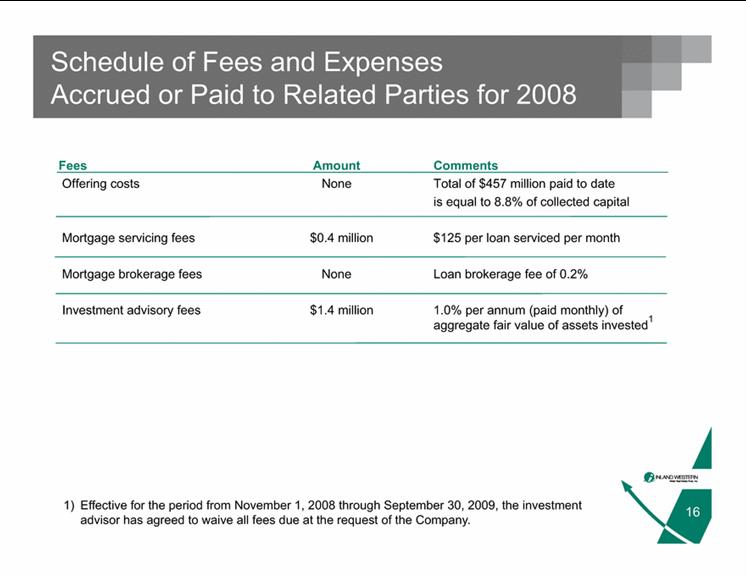
Schedule of Fees and Expenses Accrued or Paid to Related Parties for 2008 Fees Amount Comments Offering costs None Total of $457 million paid to date is equal to 8.8% of collected capital Mortgage servicing fees $0.4 million $125 per loan serviced per month Mortgage brokerage fees None Loan brokerage fee of 0.2% Investment advisory fees $1.4 million 1.0% per annum (paid monthly) of aggregate 1 fair value of assets invested 16 1) Effective for the period from November 1, 2008 through September 30, 2009, the investment advisor has agreed to waive all fees due at the request of the Company. |
|
|
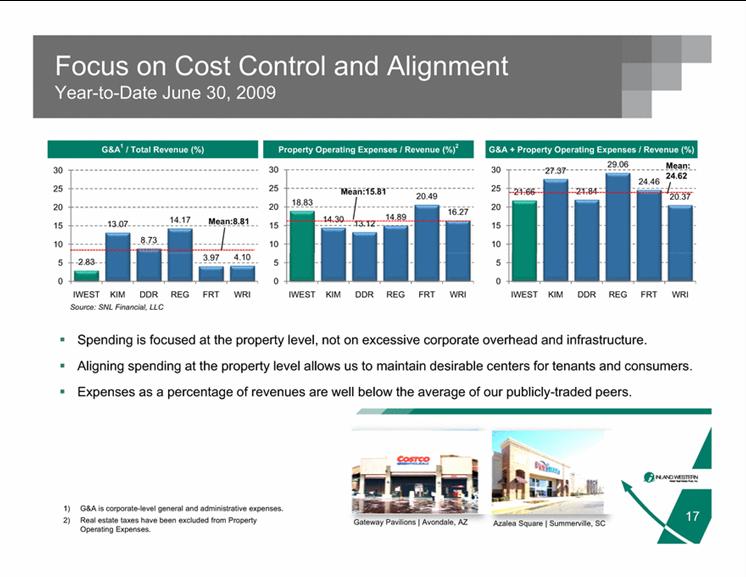
Focus on Cost Control and Alignment Year-to-Date June 30, 2009 G&A + Property Operating Expenses / Revenue (%) Property Operating Expenses / Revenue (%)2 G&A1 / Total Revenue (%) 27.37 29.06 Mean: 24.62 21.66 21.84 24.46 20.37 10 15 20 25 30 18.83 14.30 13.12 14.89 20.49 16.27 10 15 20 25 30 13.07 8.73 14.17 10 15 20 25 30 Mean:8.81 Mean:15.81 0 5 IWEST KIM DDR REG FRT WRI 0 5 IWEST KIM DDR REG FRT WRI 2.83 3.97 4.10 0 5 IWEST KIM DDR REG FRT WRI Source: SNL Financial, LLC Spending is focused at the property level, not on excessive corporate overhead and infrastructure. Aligning spending at the property level allows us to maintain desirable centers for tenants and consumers. Expenses as a percentage of revenues are well below the average of our publicly-traded peers. 1) G&A is corporate-level general and administrative expenses. 2) Real estate taxes have been excluded from Property Operating Expenses. Gateway Pavilions | Avondale, AZ Azalea Square | Summerville, SC |
|
|
Portfolio Update |

|
|
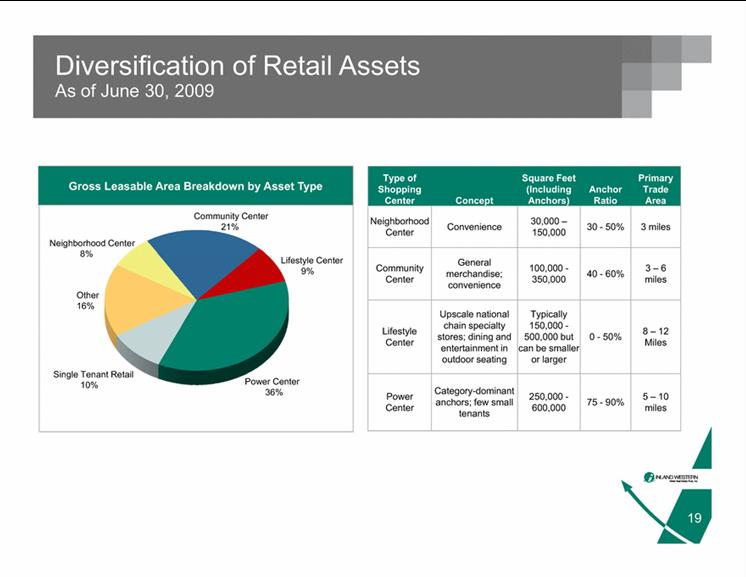
Diversification of Retail Assets As of June 30, 2009 Primary Gross Leasable Area Breakdown by Asset Type Type of Shopping Center Concept Square Feet (Including Anchors) Anchor Ratio Trade Area Neighborhood Center Convenience 30,000 – 150,000 30 - 50% 3 miles Community Center 21% Neighborhood Center 8% Community Center General merchandise; convenience 100,000 - 350,000 40 - 60% 3 – 6 miles Upscale national chain Typically Other 16% Lifestyle Center 9% Lifestyle Center specialty stores; dining and entertainment in outdoor seating 150,000 - 500,000 but can be smaller or larger 0 - 50% 8 – 12 Miles Power Category-dominant 5 – 10 Power Center 36% Single Tenant Retail 10% Center anchors; few small tenants 250,000 - 600,000 75 - 90% miles 19 |
|
|
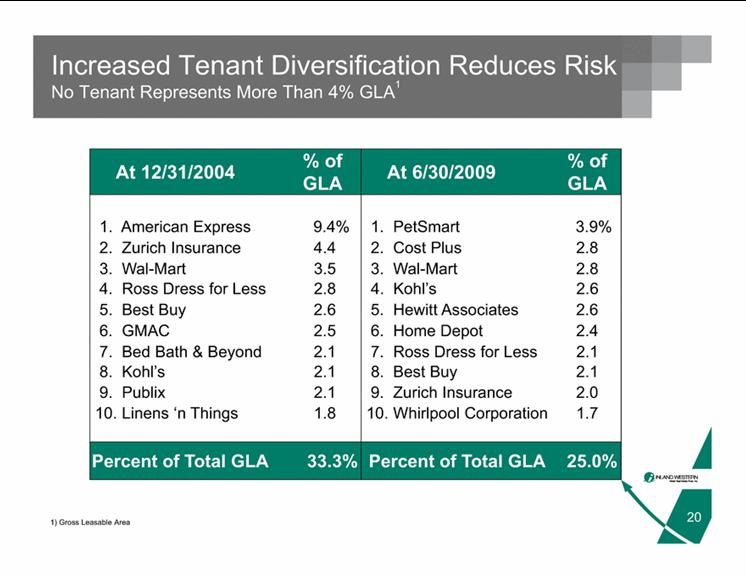
Increased Tenant Diversification Reduces Risk No Tenant Represents More Than 4% GLA1 At 12/31/2004 % of GLA At 6/30/2009 % of GLA 1. American Express 9.4% 1. PetSmart 3.9% 4.4 2. Cost Plus 2.8 2. Zurich Insurance 3. Wal-Mart 3.5 3. Wal-Mart 2.8 4. Ross Dress for Less 2.8 4. Kohl’s 2.6 5. Best Buy 2.6 5. Hewitt Associates 2.6 6. GMAC 2.5 6. Home Depot 2.4 7. Bed Bath & Beyond 2.1 7. Ross Dress for Less 2.1 8. Kohl’s 2.1 8. Best Buy 2.1 9. Publix 2.1 9. Zurich Insurance 2.0 10. Linens ‘n Things 1.8 10. Whirlpool Corporation 1.7 Percent of Total GLA 33.3% Percent of Total GLA 25.0% 20 1) Gross Leasable Area |
|
|
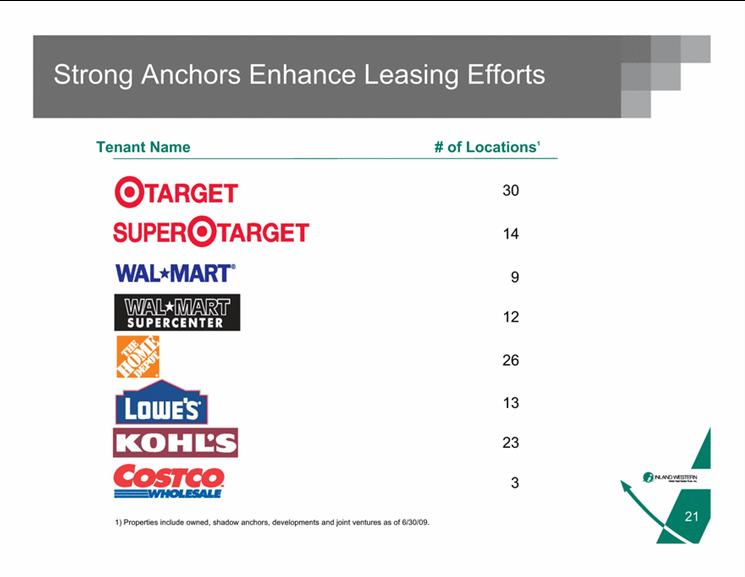
Strong Anchors Enhance Leasing Efforts Tenant Name # of Locations1 30 14 9 12 26 13 23 3 21 1) Properties include owned, shadow anchors, developments and joint ventures as of 6/30/09. |
|
|
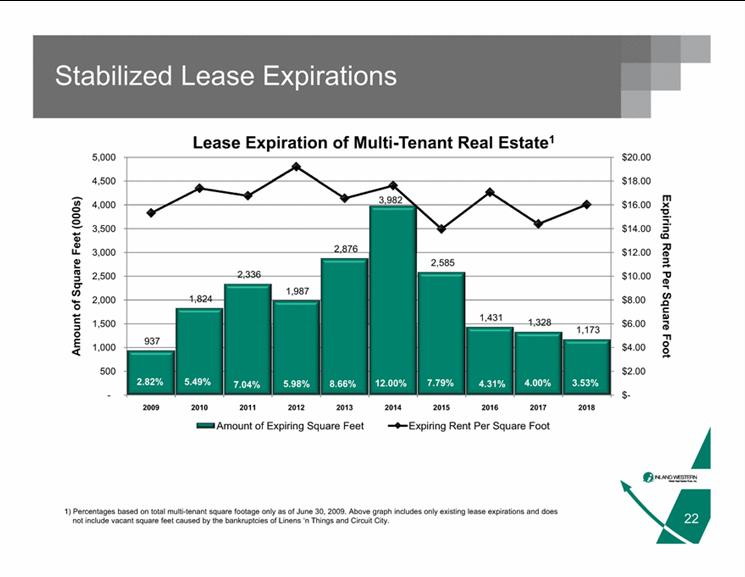
Stabilized Lease Expirations $18.00 $20.00 4,500 5,000 Lease Expiration of Multi-Tenant Real Estate1 2,876 3,982 $12.00 $14.00 $16.00 3,000 3,500 4,000 Expiring Rent Feet (000s) 1,824 2,336 1,987 2,585 1,431 1,328 $6.00 $8.00 $10.00 1,500 2,000 2,500 Per Square unt of Square F 937 1,173 $- $2.00 $4.00 - 500 1,000 1,500 Foot Amou 7.04% 5.49% 5.98% 8.66% 12.00% 7.79% 4.31% 4.00% 3.53% 2.82% $ 2009 2010 2011 2012 2013 2014 2015 2016 2017 2018 Amount of Expiring Square Feet Expiring Rent Per Square Foot 1) Percentages based on total multi-tenant square footage only as of June 30, 2009. Above graph includes only existing lease expirations and does not include vacant square feet caused by the bankruptcies of Linens ‘n Things and Circuit City. |
|
|
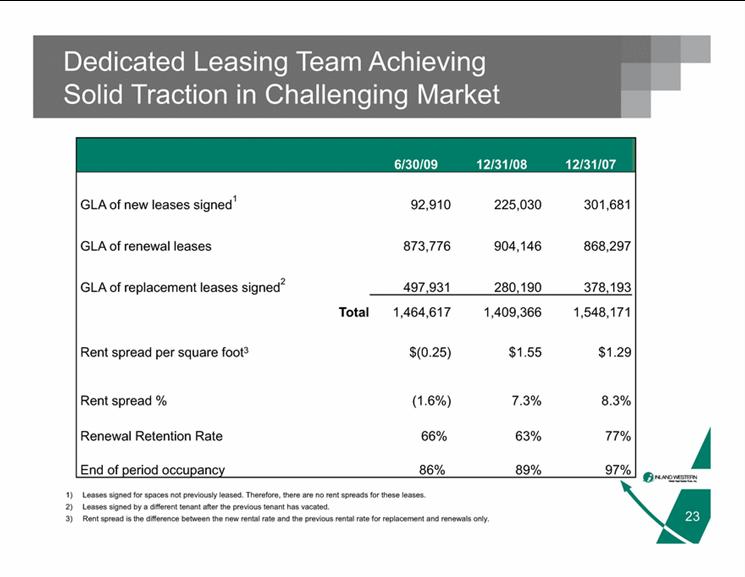
Dedicated Leasing Team Achieving Solid Traction in Challenging Market 6/30/09 12/31/08 12/31/07 GLA of new leases signed1 92,910 225,030 301,681 GLA of renewal leases 873,776 904,146 868,297 GLA of replacement leases signed2 497,931 280,190 378,193 Total 1,464,617 1,409,366 1,548,171 Rent spread per square foot3 $(0.25) $1.55 $1.29 (1.6%) 7.3% 8.3% Rent spread % Renewal Retention Rate 66% 63% 77% End of period occupancy 86% 89% 97% 23 1) Leases signed for spaces not previously leased. Therefore, there are no rent spreads for these leases. 2) Leases signed by a different tenant after the previous tenant has vacated. 3) Rent spread is the difference between the new rental rate and the previous rental rate for replacement and renewals only. |
|
|
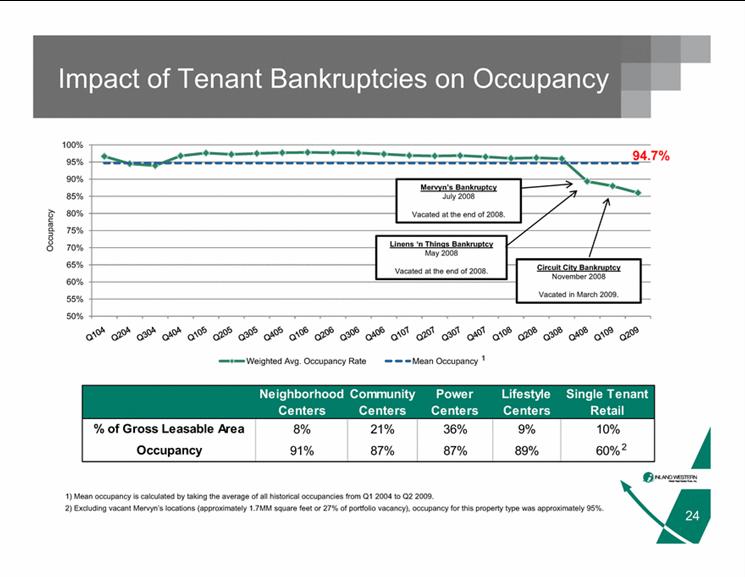
Impact of Tenant Bankruptcies on Occupancy 94.7% 90% 95% 100% 70% 75% 80% 85% Occupancy Linens ‘n Things Bankruptcy May Mervyn’s Bankruptcy July 2008 Vacated at the end of 2008. 50% 55% 60% 65% Circuit City Bankruptcy November 2008 Vacated in March 2009. 2008 Vacated at the end of 2008. Weighted Avg. Occupancy Rate Mean Occupancy 1 Neighborhood Community Power Lifestyle Single Tenant Centers Centers Centers Centers Retail 8% 21% 36% 9% 10% 91% 87% 87% 89% 60% % of Gross Leasable Area Occupancy 2 24 1) Mean occupancy is calculated by taking the average of all historical occupancies from Q1 2004 to Q2 2009. 2) Excluding vacant Mervyn’s locations (approximately 1.7MM square feet or 27% of portfolio vacancy), occupancy for this property type was approximately 95%. |
|
|
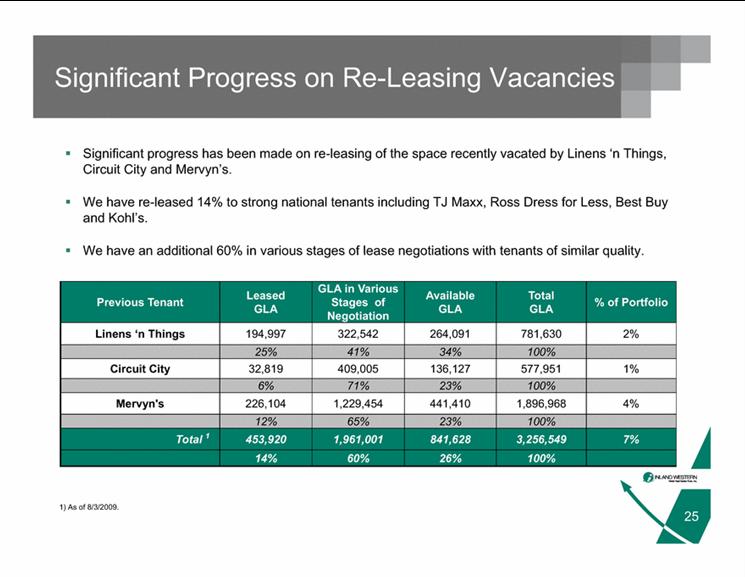
Significant Progress on Re-Leasing Vacancies Significant progress has been made on re-leasing of the space recently vacated by Linens ‘n Things, Circuit City and Mervyn’s. We have re-leased 14% to strong national tenants including TJ Maxx, Ross Dress for Less, Best Buy and Kohl’s. We have Previous Tenant Leased GLA GLA in Various Stages of Negotiation Available GLA Total GLA % of Portfolio an additional 60% in various stages of lease negotiations with tenants of similar quality. Linens ‘n Things 194,997 322,542 264,091 781,630 2% 25% 41% 34% 100% Circuit City 32,819 409,005 136,127 577,951 1% 6% 71% 23% 100% Mervyn's 226,104 1,229,454 441,410 1,896,968 4% 12% 65% 23% 100% Total 1 453,920 1,961,001 841,628 3,256,549 7% 14% 60% 26% 100% 25 1) As of 8/3/2009. |
|
|
Closing |
|
|
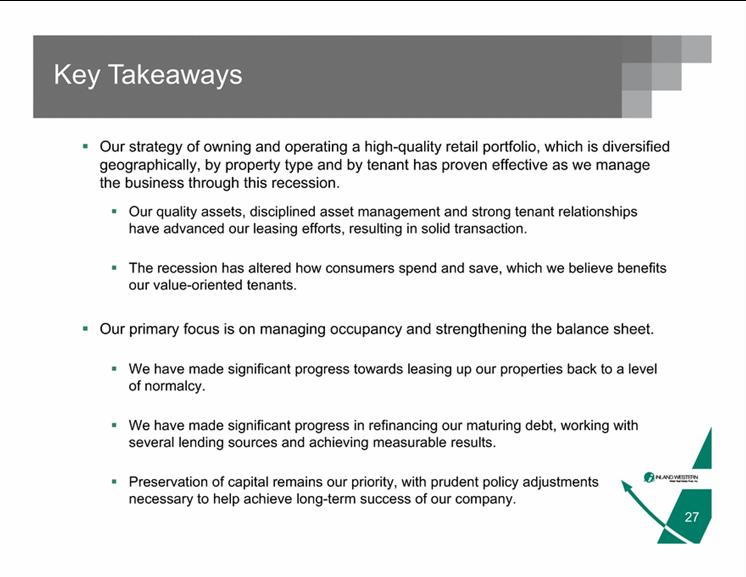
Key Takeaways Our strategy of owning and operating a high-quality retail portfolio, which is diversified geographically, by property type and by tenant has proven effective as we manage the business through this recession. Our quality assets, disciplined asset management and strong tenant relationships have advanced our leasing efforts, resulting in solid transaction. The recession has altered how consumers spend and save, which we believe benefits our value-oriented tenants. Our primary focus is on managing occupancy and strengthening the balance sheet. We have made significant progress towards leasing up our properties back to a level of normalcy. We have made significant progress in refinancing our maturing debt, working with several lending sources and achieving measurable results. Preservation of capital remains our priority, with prudent policy adjustments necessary to help achieve long-term success of our company. 27 |
|
|
Forward-Looking Statements Certain statements in this presentation may constitute “forward-looking statements.” Forward-looking statements are statements that are not historical, including statements regarding management’s intentions, beliefs, expectations, representations, plans or predictions of the future and are typically identified by such words as “believe,” “expect,” “anticipate,” “intend,” “estimate,” “may,” “will,” “should” and “could.” We intend that such forward-looking statements be subject to the safe harbor provisions created by Section 27A of the Securities Act of 1933 and Section 21E of the Securities Exchange Act of 1934 and the Federal Private Securities Litigation Reform Act of 1995 and we include this statement for the purpose of complying with such safe harbor provisions. Future events and actual results, performance, transactions or achievements, financial or otherwise, may differ materially from the results, performance, transactions or achievements expressed or implied by the forward-looking statements. Risks, uncertainties and other factors that might cause such differences, some of which could be material, include, but are not limited to: • Our financial condition will be materially adversely affected if we are unable to refinance all or substantially all of our remaining indebtedness maturing in 2009 or 2010. Approximately $1.1 billion of our indebtedness matures during 2009, including approximately $867 million in the third and fourth quarters of 2009, and approximately an additional $1.3 billion will mature in 2010; • Our financial condition may be affected by required debt service payments, the risk of default and restrictions on our ability to incur additional debt or enter into certain transactions under our credit agreement. In addition, we may encounter difficulties in obtaining permanent financing or refinancing existing debt; • National or local economic, business, real estate and other market conditions, including the ability of the general economy to recover timely from the current volatile economic downturn; • The level and volatility of interest rates as well as significant challenges in the debt markets that may adversely affect our ability to obtain permanent financing or refinance our existing indebtedness; • General financial risks affecting the real estate industry, including the current economic downturn that may adversely affect the ability of our tenants, or new tenants, to enter into new leases or the ability of our existing tenants to renew their leases at rates at least as favorable as their current rates or at all; • Financial stability of tenants, including the ability of tenants to pay rent, the decision of tenants to close stores and the effect of bankruptcy laws and our ability to re-lease any resulting vacant space; • Risks of real estate development, including the failure of pending developments and redevelopments to be completed on time and within budget and the failure of newly acquired or developed properties to perform as expected; • The ability to dispose of properties on favorable terms or at all as real estate investments can be illiquid, particularly as prospective buyers may experience increased costs of financing or difficulties obtaining financing; • Risks of joint venture activities, including development joint ventures; • The effect of inflation and other factors on fixed rental rates, operating expenses and real estate taxes; • The competitive environment in which we operate and the supply of and demand for retail goods and services in our markets; • The increase in property and liability insurance costs and the ability to obtain appropriate insurance coverage; • The ability to maintain our status as a REIT for federal income tax purposes; • The effects of hurricanes and other natural disasters; • Environmental/safety requirements and costs; and • Other risks identified in this presentation and, from time to time, in other reports we file with the Securities and Exchange Commission (SEC). We disclaim any intention or obligation to update or revise any forward-looking statement whether as a result of new information, future events or otherwise. Readers are cautioned not to place undue reliance on these forward-looking statements, which speak only as of June 30, 2009. This presentation should also be read in conjunction with our Annual Report on Form 10-K for the year ended December 31, 2008 and with our Quarterly Report on Form 10-Q for the period ended June 30, 2009, filed with the SEC on March 31, 2009 and August 12, 2009, respectively. Tenant Photographs and Logos The companies depicted may have proprietary interests in their trade names and trademarks. Nothing herein shall be considered to be an endorsement authorization or approval of Inland Western Retail Real Estate Trust, Inc. by the aforementioned companies. Further, none of the aforementioned companies are affiliated with Inland Western Retail Real Estate Trust, Inc. in any manner, other than being a tenant in 28 properties that Inland Western Retail Real Estate Trust, Inc. owns or has interest in. Property Photographs Properties depicted in photographs in this presentation are wholly or partially owned by Inland Western Retail Real Estate Trust, Inc. However, some photographs are of shadow anchors, which are located in or adjacent to our center, but that are not owned by Inland Western Retail Real Estate Trust, Inc. |